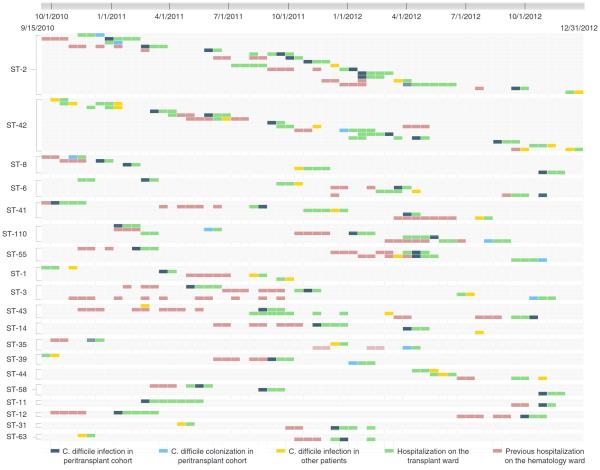
FIGURE 4.
Time-space cluster map of shared sequence types from patients (represented on each row) with Clostridium difficile infection and colonization on the transplant unit (y-axis depicts unique multilocus sequence types). The x-axis (top) shows the duration of the study period; each small box approximates a 2-week interval. Color codes for hospitalization on transplant and leukemia units and timing of C. difficile isolation are shown at the bottom of the figure.

