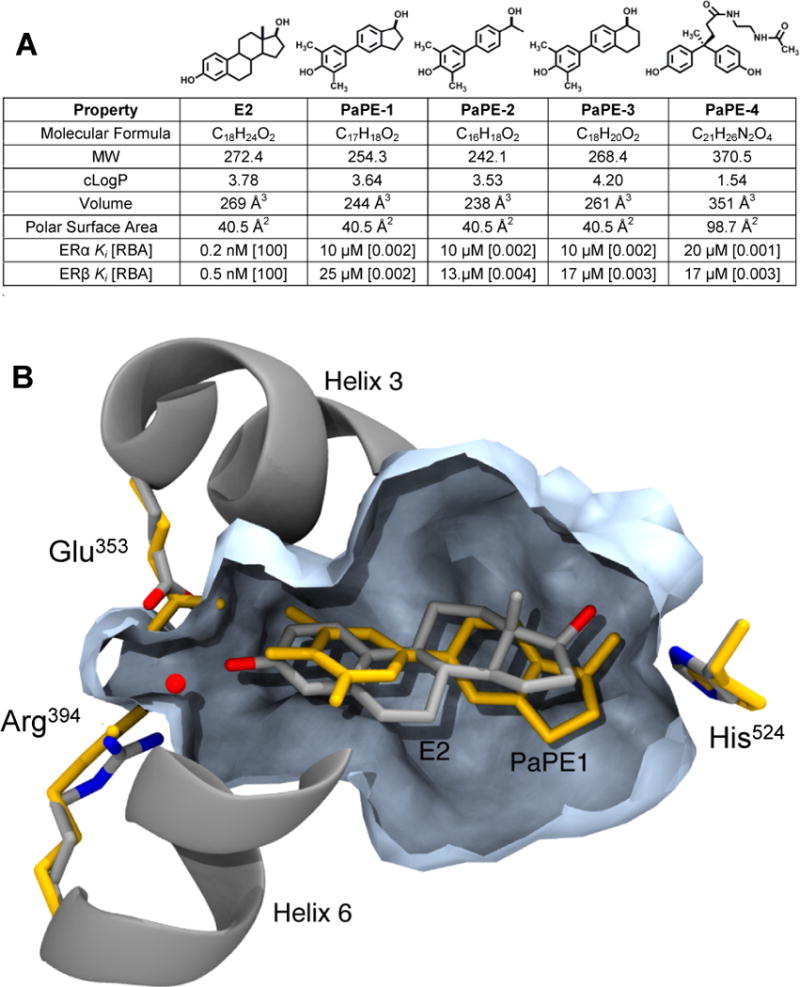
Figure 1. Structures and molecular and binding properties of E2 and four PaPEs, and a model of E2 and PaPE-1 binding to ERα ligand-binding domain.

(A) MW is molecular weight; cLogP is Log10 of the calculated octanol-water partition coefficient; Volume is molecular volume; Polar Surface Area is a measure of compound polarity. All values were obtained using ChemBioDraw Ultra (ver. 13.0.0.3015). Relative binding affinity (RBA) values were determined by competitive radiometric binding assays (18). E2 is set at 100 on both ERs. Ki values calculated as Ki = Kd (for E2) × (100/RBA), where Kd of E2 is 0.2 nM (ERα) and 0.5 nM (ERβ). Values are average of 3–4 determinations with coefficients of variation <0.3. (B) Computational model comparing PaPE-1 and E2 in the ligand-binding pocket of ERα. The model of ERα+E2, based on a crystal structure (PDB ID 1GWR), has E2 and helical elements shown in silver/grey and the pocket volume contour in slate blue. The model for PaPE-1 was generated from the ERα+E2 structure by progressive transformation of the ligand structure from E2 to PaPE-1, partnered with progressive minimization of the ligand and the ligand-binding domain. The resulting positions of the PaPE-1 ligand and hydrogen bonding residues are shown in orange.
