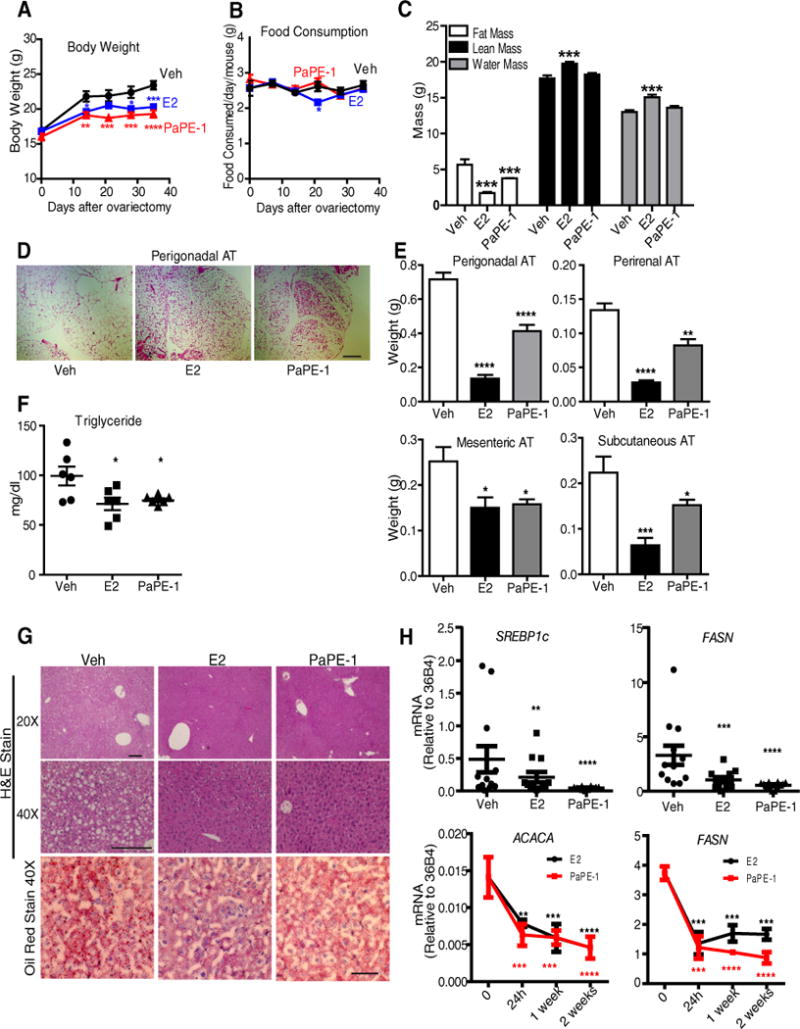
Figure 5. Like E2, PaPE-1 reduces the increase in body weight after ovariectomy and reduces adipose stores and blood triglyceride concentrations.

(A) PaPE-1 is effective in normalizing body weight after ovariectomy. Ovariectomized C57BL/6 mice were implanted with pellets containing E2 or PaPE-1 or Veh control for 3 weeks (n = 8 mice/group). Animals were on a normal chow diet. Two-way ANOVA, Bonferroni posttest, * p<0.05, ** p<0.01, *** p<0.001, **** p<0.0001, comparing treatments to Veh. (B) Food consumption for each mouse from A was monitored weekly. (C) Body composition for each mouse from A was monitored using EchoMRI at the end of 3 weeks. One-way ANOVA, Newman-Keuls post-test, * p<0.05, ** p<0.01, *** p<0.001, **** p<0.0001. (D) H&E staining of perigonadal adipose tissue (AT). Images are representative of 8 mice per group. Scale bar, 500 μm. (E) Weights of various adipose tissue (AT) depots after 3 weeks of control vehicle or ligand exposure. (F) Triglycerides were measured in the blood of animals (n=6 mice/group) at the end of 3 weeks of Veh, E2 or PaPE-1 treatment. (G) H&E staining (upper 2 rows; scale bars, 100 μm) and Oil Red O staining (lower panel; scale bar, 20 μm) of the liver after 3 weeks of treatment. Images are representative of 8 mice per group. (H) Gene expression analysis of SREBP1c and FASN in the liver at 3 weeks (upper panel) (n=12 mice/group), and time course of FASN and ACACA expression in the livers of E2 and PaPE-1 treated mice (n=3 mice/group). A two-way analysis of variance (ANOVA) model was fitted to assess the contribution of ligand treatment and time of ligand treatment on body weight, food consumption or gene expression. A one-way analysis of variance (ANOVA) model was fitted to assess the contribution of ligand treatment on fat mass, lean mass, water mass, triglyceride concentrations, weight of different fat depots or gene expression. When the main effects were statistically significant at α=0.05, pairwise t-tests with a Bonferroni correction were employed to identify the treatments that were significantly different from each other. * p<0.05, ** p<0.01, *** p<0.001, **** p<0.0001.
