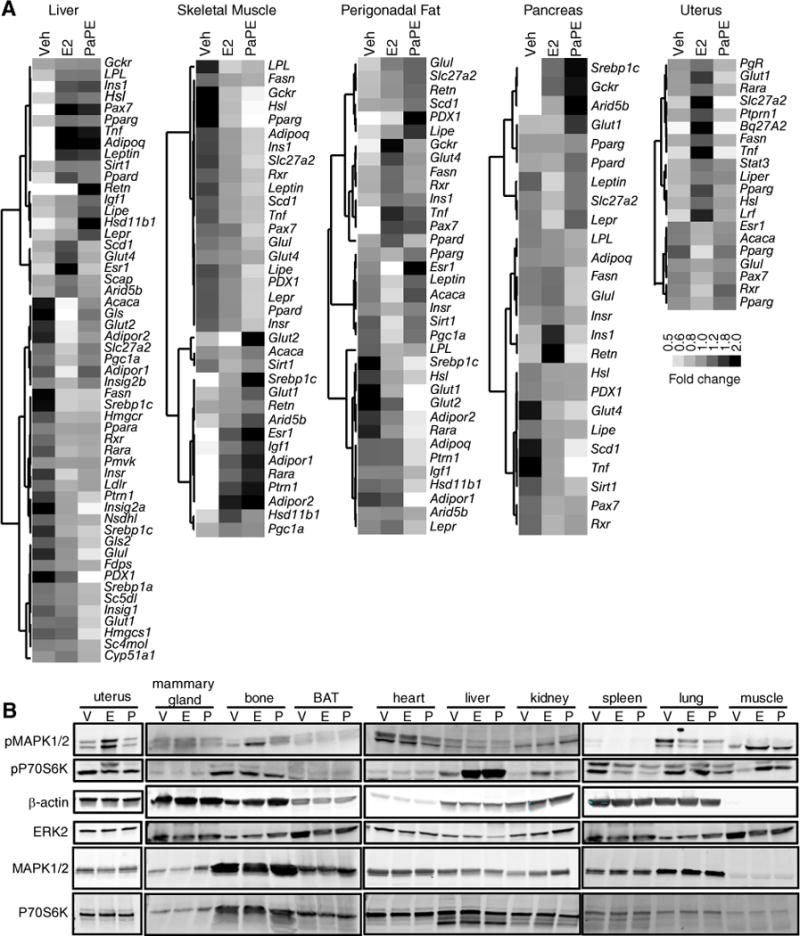
Figure 6. Gene regulation and signaling pathway activations by PaPE-1 and E2 in tissues in vivo.

(A) Ovariectomized C57BL/6 mice were implanted with pellets containing E2 and PaPE-1. Liver, skeletal muscle, perigonadal fat, pancreas, and uterus were harvested. RNA was isolated and qPCR performed for the indicated genes. N=8 mice/treatment. (B) PaPE-1 activates mTOR signaling (as monitored by increased phosphorylation of S6) in liver and skeletal muscle. Ovariectomized C57BL/6 mice were injected with E2 (E) or PaPE-1 (P) for 2h. The indicated tissues were collected and subjected to Western blot analysis for phosphorylated (p) S6 and MAPK1/2. β-Actin and total ERK2 were used as loading controls. Total MAPK1/2 and total P70S6K are also shown. N=3 mice/treatment.
