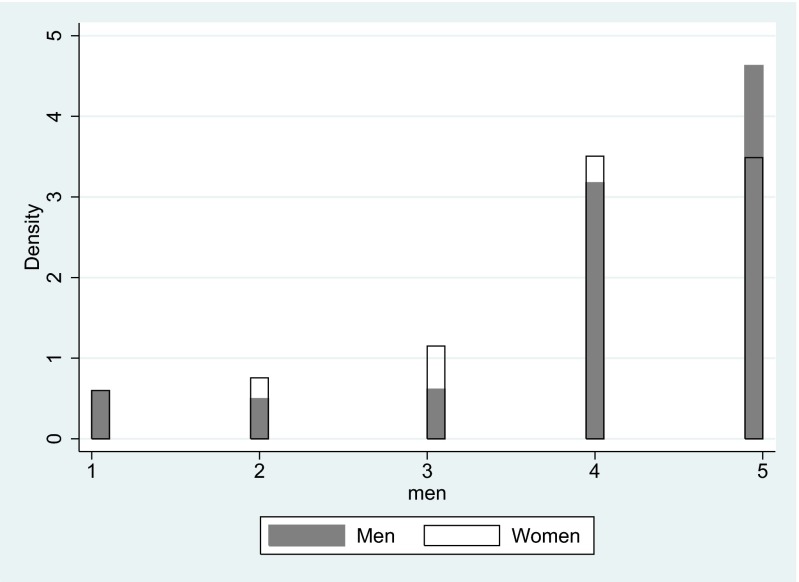
Fig. S1.
Distribution of answers to time-discounting question. This figure shows the distribution of answers to the question: “If you had to choose between SEK 900 [USD 138] now versus SEK 9,000 [USD 1,380] in five years, what would you choose?”. Categories 1–5 represent respondents stating: “Certainly SEK 900 now” (1), “Probably SEK 900 now” (2), “Cannot choose” (3), “Probably SEK 9,000 in five years” (4), “Certainly SEK 9,000 in five years” (5). The amounts are presented in current prices. The sample consists of all children born in Stockholm County in the year 1953. The survey was administrated to children aged 13 y.

