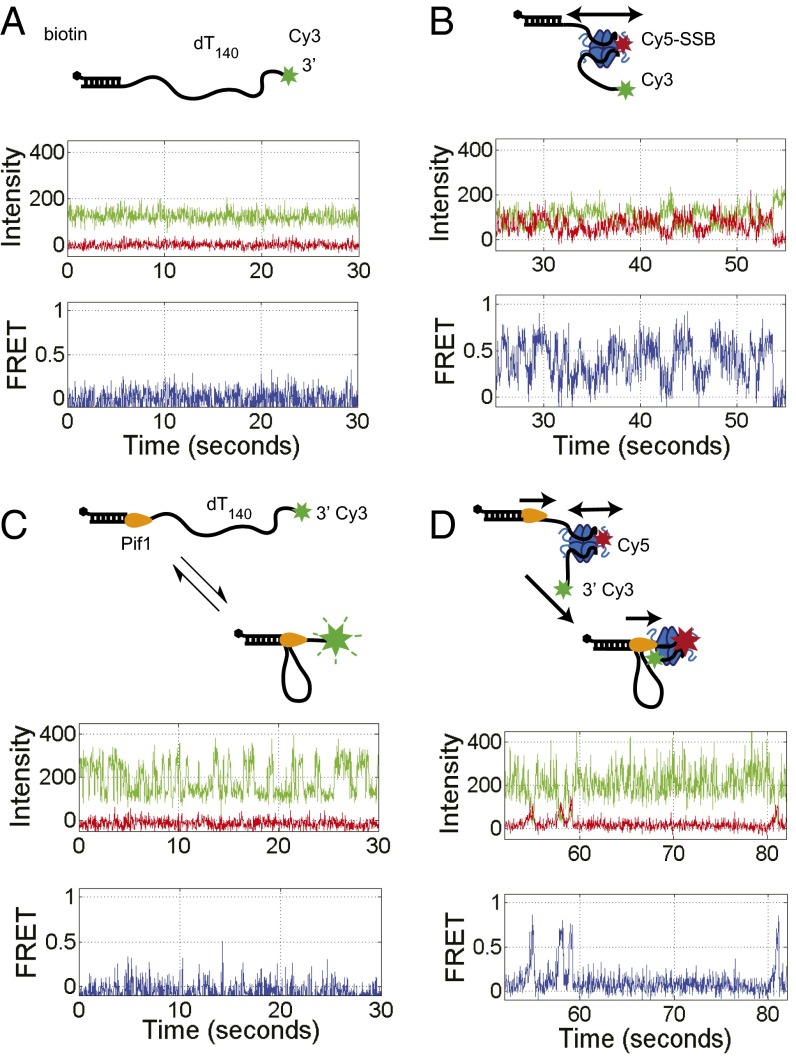
Fig. 1.
Single molecule TIRF time trajectories showing SSB pushing by Pif1. (A) 3′dT-Cy3-(dT)140 DNA immobilized on the slide surface via a biotin-Neutravidin-biotin linkage displays only Cy3 fluorescence. (B) On addition of Cy5-SSB(A122C) (1 mM) and washing out free protein, anticorrelated Cy3 and Cy5 fluorescence fluctuations are observed indicating SSB diffusion along the ssDNA. (C) Addition of Pif1 (100 nM) to the 3′dT-Cy3-(dT)140 DNA, followed by ATP (5 mM) and washing out free protein, results in repetitive Cy3 enhancement (PIFE) spikes. (D) Addition of Pif1 (100 nM) with ATP (5 mM) to the 3′dT-Cy3-(dT)140 DNA prebound with Cy5-SSB results in a replacement of SSB diffusing FRET signals with Pif1 translocating PIFE signals and intermittent asymmetric FRET spikes reflecting Pif1 pushing of SSB in a 5′ to 3′ direction. Green, Cy3 fluorescence; red, Cy5 fluorescence; blue, FRET efficiency calculated from the Cy3 and Cy5 signals. Solution conditions: 30 mM Tris⋅HCl, pH 8.1, 100 mM NaCl, 5 mM MgCl2, 1 mM DTT, 0.1 mg/mL BSA, 0.5% (wt/vol) dextrose, 3 mM Trolox, 1 mg/mL glucose oxidase, and 0.4 mg/mL catalase, 25 °C.

