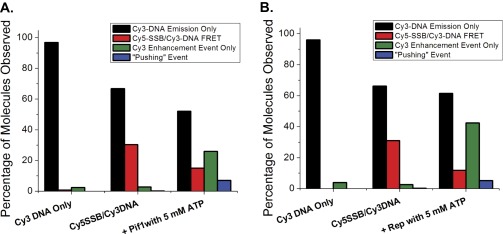
Fig. S3.
Observed signal distributions for each step in a translocase-SSB pushing assay. (A) Percentage of each type of single molecule behavior observed for each condition for Pif1 pushing and displacement of Cy5-SSB: surface immobilized 3′-Cy3-(dT)140 DNA: n = 419; 3′-Cy3-(dT)140 DNA postincubation with 1 nM Cy5-SSBtet, N = 1,124 ; 3′-Cy3-(dT)140 DNA/Cy5-SSB within 1 min of addition of 100 nM Pif1 and 50 μM ATP, n = 127. (B) Percentage of each type of single molecule behavior observed for each condition for Rep pushing and displacement of Cy5-SSB: surface immobilized 5′-Cy3-(dT)140 DNA, n = 281; 5′-Cy3 (dT)140 DNA postincubation with 1 nM Cy5-SSB, N = 466; 5′-Cy3-(dT)140 DNA/Cy5-SSB within 1 min of addition of 100 nM Rep and 5 mM ATP, n = 288. Cy3 DNA emission only (black columns) had only stable Cy3 emission with no enhancement spikes or Cy5 emission observed. Cy5-SSB/Cy3-DNA FRET (red columns) displayed anticorrelated Cy3 and Cy5 emission. The Cy3 enhancement event (green columns) exhibited saw-tooth spikes of enhanced Cy3 emission (PIFE). Pushing event (blue column) indicates molecules that show a high FRET signal that disappears in a near step function and is replaced by repetitive Cy3 enhancement (PIFE).

