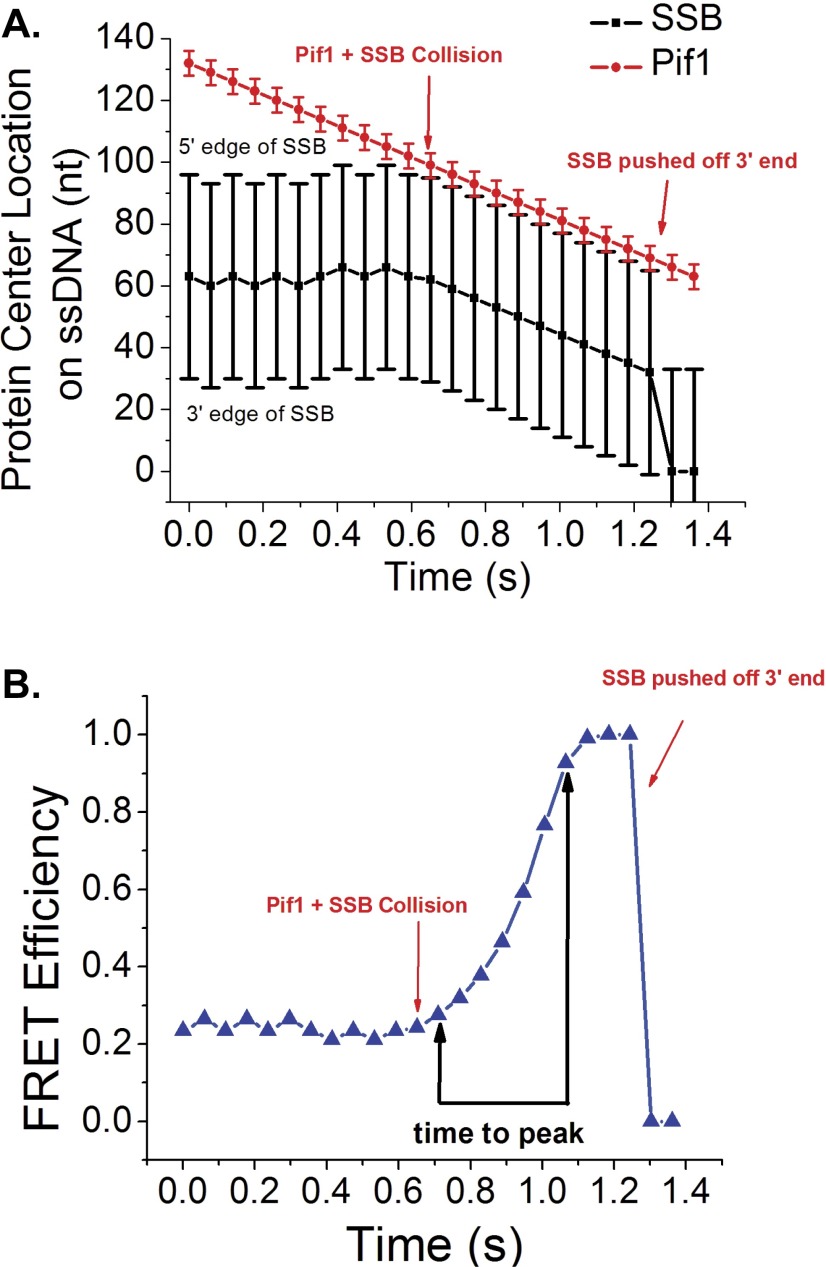
Fig. S9.
Results of a simulation of Pif1 pushing SSB along ssDNA via active pushing. (A) Simulated protein positions on the ssDNA lattice during a single simulation. Black squares represent the center of mass position for EcSSB and the bars represent the position of the 5′ and 3′ edges of the bound protein. Red circles represent the center of mass position for ScPif1 and the bars represent the 5′ and 3′ edges of the translocase. In the simulation, the Pif1 translocase motor starts at the extreme 5′ end of the DNA lattice and advances in the 3′ direction, whereas the SSB undergoes a random walk along the DNA. A collision occurs when the 3′ edge of the Pif1 overlaps with the 5′ edge of the SSB. After the collision, the Pif1 and SSB move as a single unit toward the 3′ end of the DNA. The active displacement of SSB from the DNA end is represented as the SSB position going to 0. (B) The corresponding FRET efficiency predicted for the simulation in A determined from the distance between the 3′ edge of the SSB and the 3′ end of the DNA. The 3D distance was estimated by modeling the ssDNA between the SSB edge and the 3′ end as a modified worm-like chain and the FRET efficiency was calculated using a Fӧrster distance of 56 Å.

