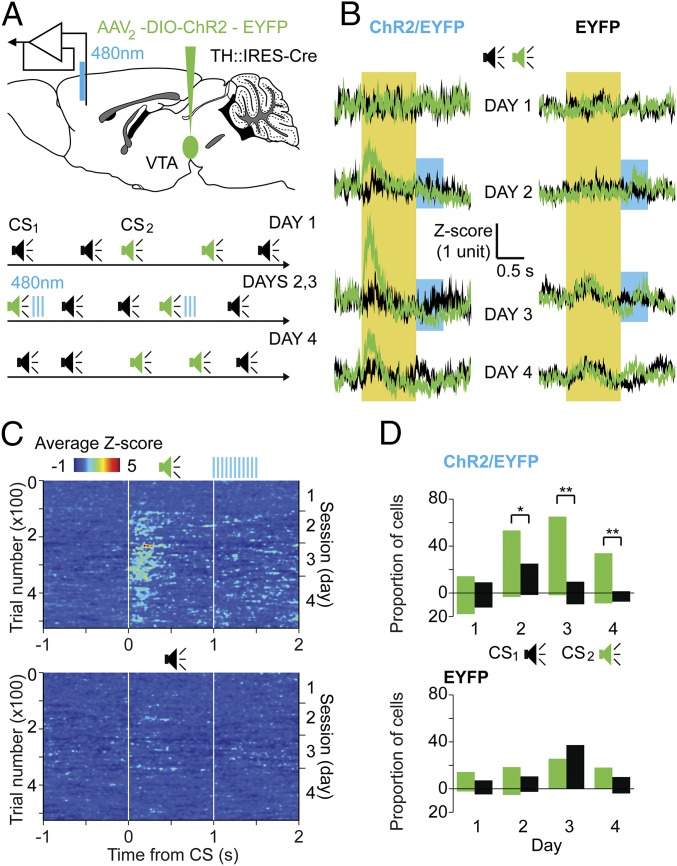
Fig. 2.
Optogenetic stimulation of DA axons in mPFC enhanced neuronal responses to the temporally paired CSs. (A, Upper) Schematic diagram showing the site of injection for viral-mediated expression of ChR2/EYFP (or EYFP only for controls) in DA neurons of TH-Cre mice and optrode placement in mPFC for extracellular recordings and local stimulation of DA axons. (A, Lower) Experimental protocol: two tones (CS1, black; CS2, green; 1-s duration) were randomly interspersed during daily 1-h sessions. During d2 and d3, CS2 was followed by laser stimulation of local DA axons (20-ms pulses, 0.5 s, 30 Hz). (B) Population average of single-unit recordings in the experimental group (ChR2/EYFP, Left) vs. control group (EYFP, Right) are shown as neuronal firing responses to CS2 (green traces) and CS1 (black traces). Data are presented as mean ± SEM of peristimulus histograms of all individual units converted to Z-scores for each session (52–68 units per day from four ChR2/EYFP and three EYFP mice). The yellow area is the time of the CS (CS1 or CS2), and the blue area is the period of laser stimulation following CS2. (C) Population neuronal firing responses evoked by individual CS1 (Bottom) and CS2 (Top, left side y axis) over the 4 d of recording (right side y axis) in ChR2/EYFP-injected mice. Data were converted to Z-scores and averaged across all units and mice (z axis, color-coded). White lines represent the beginning and end of each CS, and blue lines at the top represent the laser stimulation period. (D) Percentage of recorded neurons that significantly increased (upward bars) or decreased (downward bars) their firing rates in response to CS1 (black) and CS2 (green) across days, for ChR2/EYFP (Top) or EYFP (Bottom) mice. A significant difference between responses to CS1 and CS2 distributions was found in the ChR2/EYFP group on d2, d3, and d4 [χ2 tests: d2, χ2(2) = 11.1, *P = 0.004; d3, χ2(2) = 34.8, **P < 0.001; d4, χ2(2) = 20.38, **P < 0.001].

