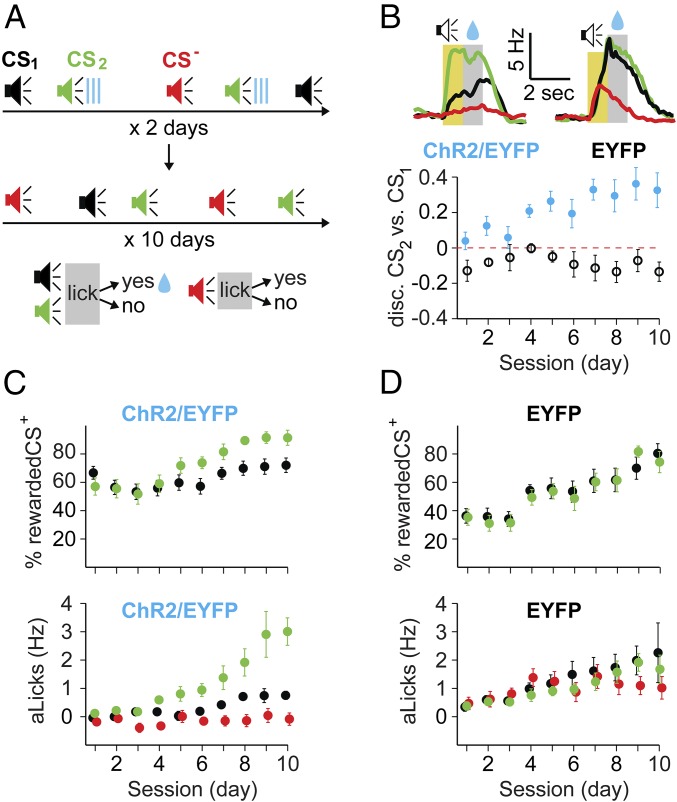
Fig. 3.
Pairing of CSs with DA release in mPFC was sufficient to bias subsequent stimulus discrimination learning. (A) Diagram depicting the experimental protocol: TH-Cre mice, expressing ChR2/EYFP or EYFP-only in DA neurons and optic-fiber implants in mPFC were exposed for 2 d to three randomly interspersed tones (CS1, black; CS2, green; CS−, red; 1 s; different frequencies), and CS2 was immediately followed by laser stimulation of DA axons in mPFC. Mice were then trained to lick for reward at the end of CS1 and CS2 over the next 10 d, whereas CS− remained unrewarded. (B) Different licking behavior in the experimental (ChR2/EYFP) and control (EYFP) groups. (Top) Representative examples of licking during d8 are presented as the average licking rate in response to various CSs for the two groups. The yellow area is the duration of the CS, and the gray area is the reward period. (Bottom) Average CS2 vs. CS1 discrimination score (normalized difference in aLicks) for the ChR2/EYFP (blue) and EYFP (black) groups across sessions (x axis). The red dotted line represents a score of 0 (no preference); error bars are SEM. (C and D, Top) Progression of the percentage of rewarded CSs (y axis; CS1, black; CS2, green) across sessions (x axis). (C and D, Bottom) aLicks in response to CSs (y axis) across sessions (x axis) for ChR2/EYFP (C) and EYFP (D) mice. Data are color-coded for the three tones (CS1, black; CS2, green; CS−, red) and presented as mean (circles) ± SEM (error bars). Note the higher starting point for the percentage of rewarded CS2 in experimental vs. control groups (54.6 ± 4.3% vs. 34.4 ± 3.1%, respectively).

