Fig. 5.
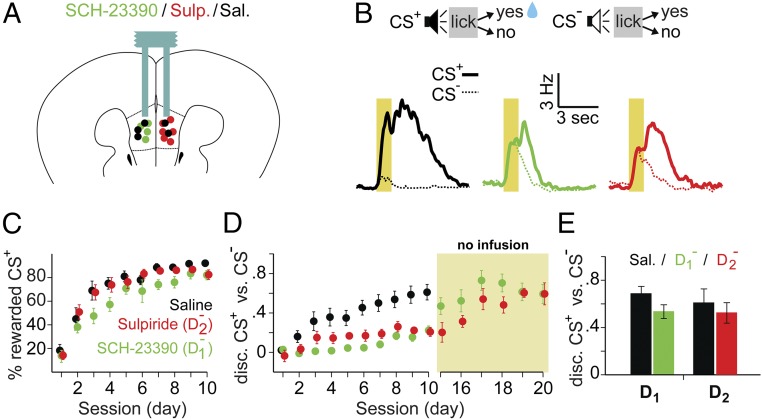
Blocking D1 or D2 receptors in mPFC impaired stimulus discrimination. (A) Schematic diagram showing bilateral cannula placement for mice receiving injections of Sal (n = 6), D1− (n = 8), or D2− (n = 9) in mPFC (black, green, and red, respectively). (B) Mice learned a two-tone discrimination task (CS+, rewarded; CS−, unrewarded). (Bottom) Traces show typical licking behavior on d8 for a mouse in each group (CS+, thick lines; CS−, thin dotted lines), using the same color code as in A. (C and D) Progression of learning is shown across sessions (x axis) as the average percentage of rewarded CS+ presentations (C) and CS+ vs. CS− discrimination score (D). Data are presented as mean (solid circles) ± SEM (error bars), with the same color code as in A. Note that although the percentages of rewarded CS+ were similar between groups, discrimination (disc.) scores were significantly different [F(2,19) = 6.924, P = 0.015; Sal 0.59 ± 0.09 vs. D1− 0.22 ± 0.04, t(12) = 3.53, P = 0.008; vs. D2− 0.19 ± 0.04, t(13) = 3.99, P = 0.003; Bonferroni corrected post hoc t tests on d10]. Several mice receiving D1− or D2− receptor antagonists (n = 4 and n = 6, respectively) were further trained without drug infusion (yellow shaded area in D) until they reached the same discrimination level as controls (D1−, 0.59 ± 0.11; D2−, 0.59 ± 0.09). (E) CS+ vs. CS− discrimination scores for sessions where these mice received alternating injections of Sal and D1− or D2−. No difference was observed between treatments [Sal vs. D1−: 0.62 ± 0.05 and 0.61 ± 0.04, t(14) = 0.04, P = 0.49; Sal vs. D2−: 0.58 ± 0.04 and 0.54 ± 0.05, t(22) = 0.87, P = 0.21]. Data are presented as mean ± SEM across mice and sessions.

