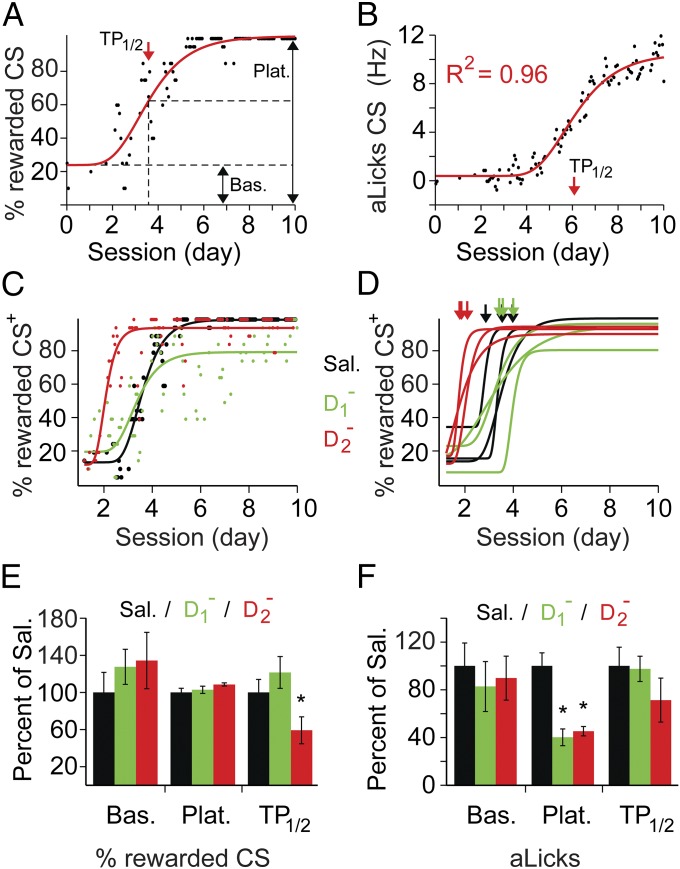
Fig. 6.
Analysis of individual learning curves reveals differential roles for D1 and D2 mPFC receptors in stimulus-discrimination learning. Examples of fit and parameter extraction for percentage of rewarded CS+ (A) and aLicks (B) from one mouse: individual data points (black dots, moving average of 20 CS+ presentations) were fitted with a sigmoid function (red lines). The baseline (Bas.), plateau (Plat.), TP1/2 (red arrows), and goodness of fit (R2) were extracted for between-group comparisons. (C) Example of sigmoidal fit (solid lines) to the percentage of rewarded CS+ vs. time (individual data points) for one mouse in each group (color code on the right). (D) Examples of color-coded sigmoidal fits (three for each: Sal, black; D1−, green; D2−, red); arrows indicate TP1/2. Note the leftward shift of TP1/2 in the D2− group. (E and F) Comparison of fit parameters between the three groups for the progression of percentage of rewarded CS+ (E) and aLicks (F). Data are presented as the mean (±SEM error bars) normalized to Sal values (*P ≤ 0.05, corrected t tests). (F) A significant reduction in plateau values was found for D1− and D2− groups [Sal: 7.87 ± 0.9; D1−: 3.16 ± 0.6, t(9) = 3.8, P = 0.004; D2− : 3.56 ± 0.31, t(11) = 4.24, P = 0.001; Bonferroni corrected t tests].

