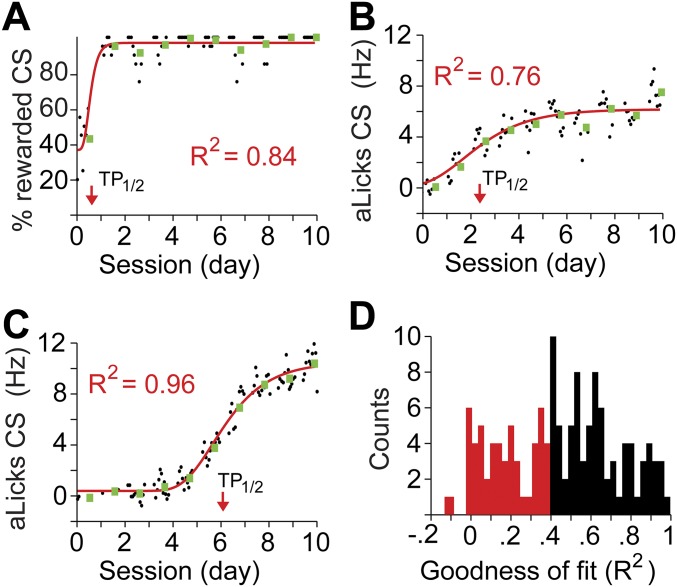
Fig. S4.
Sigmoidal fits to the learning curves revealed transition points in behavior. Examples of sigmoidal fit: Individual data points (black circles, moving average of 20 CS+ presentations) representing the percentage of rewarded CS+ across time (A, x axis) or aLicks (B and C) were fit with a sigmoid function (red lines). The baseline (Bas.), plateau (Plat.), TP1/2 (red arrows), and goodness of fit (R2) were extracted for each case. Green squares represent the average values within a full, daily session. (D) Histogram of R2 values for the sigmoidal fits of all animals used in this study (percentage of rewarded CS+ and aLicks). Red bars correspond to data that were not used in the analysis due to “poor” fit (R2 < 0.4).

