Fig. 1.
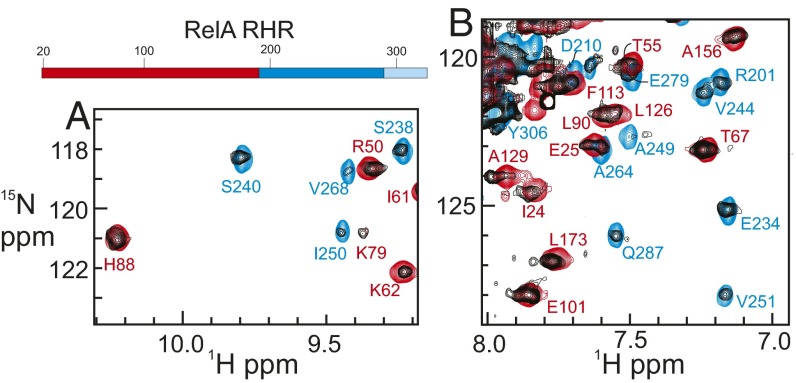
(A and B) Portions of the 1H–15N TROSY spectrum of the RelA RHR in complex with perdeuterated p50 RHR (black), superimposed on the 1H–15N TROSY spectra of the RelA DBD (residues 19–191) (red) and of the RelA DD (residues 190–321) in complex with perdeuterated p50 DD (residues 245–350) (blue). Resonance assignments were obtained from the spectra of the isolated component domains (9). (Top) Schematic diagram showing regions of RelA RHR used in this work. Red, N-terminal DBD; blue, dimerization domain; light blue, NLS. The full 1H–15N HSQC spectrum is shown in Fig. S1.

