Fig. S5.
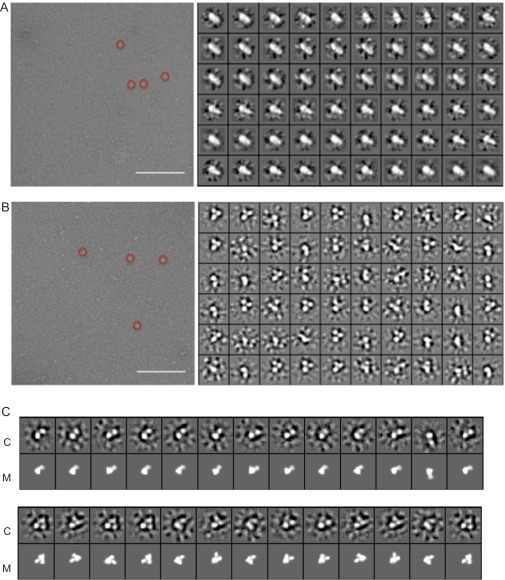
(A and B) Representative negative stain electron micrographs (Left) and 60 class averages (Right) for (A) the NF-κB–IκBα binary complex and (B) the NF-κB–DNA–IκBα ternary complex. A sample of the particles picked are enclosed with a red circle. (Scale bar on each micrograph, 200 nm.) (C) Ternary complex modeled from the crystal structures 1IKN, 1NFI, and 1VKX using the program COOT (26) and shown in orientations corresponding to one- and two-lobed class averages for the ternary complex shown in B. M, model; C, class average. The comparisons of 2D class averages with projections of the 3D model were made using e2classvsproj.py in EMAN2 (27).

