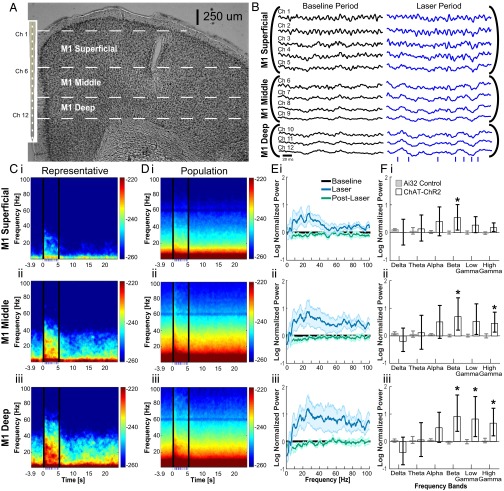
Fig. 3.
SChI activation led to layer-dependent beta and gamma oscillation changes in the M1. (A) Representative coronal section demonstrating the position of laminar electrodes in M1. (B) Representative 200-ms LFPs during the baseline period before laser simulation (black) and during laser stimulation period (blue). (C) Representative power spectrum from an individual mouse for superficial layers (C, i, averaged across Ch1–Ch5), middle layers (C, ii, averaged across Ch6–Ch9), and deep layers (C, iii, averaged across Ch10–Ch12). The 500 ms immediately after laser onset and offset were excluded from the corresponding statistics because of strong LFP deflections. (D) Population spectrograms aligned to laser onset for superficial layers (D, i), middle layers (D, ii), and deep layers (D, iii) (n = 7 mice). Bottom, blue dashes indicate the timing of laser light pulsed at Poisson-distributed 40 Hz, for 5 s. (E) Population spectrum for M1 superficial layers (E, i), middle layers (E, ii), and deep layers (E, iii). (F) Bar plots comparing oscillation powers at different frequencies in superficial (F, i), middle (F, ii), and deep (F, iii) layers for delta (1–4 Hz), theta (4–8 Hz), alpha (8–15 Hz), beta (15–30 Hz), low gamma (30–60 Hz), and high gamma (60–100 Hz). Error bars represent the bootstrapped 95% confidence intervals (*P ≤ 0.05, nonparametric signed-rank test).

