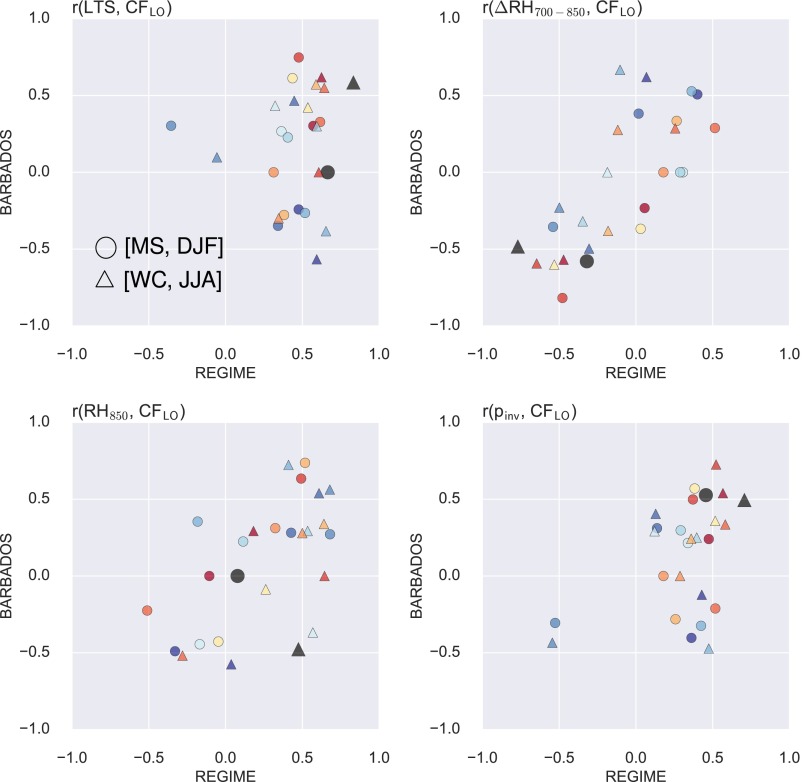
Fig. 8.
Correlation coefficients between and environmental parameters. The Barbados region is shown on the vertical, and the dynamical regime is shown on the horizontal. Circles denote the moderate subsidence and DJF sampling, and triangles show weak convection and JJA. Colors are as in Fig. 5. The values are derived by calculating the correlation coefficient at each spatial point using the monthly means, removing correlations that are not significant at the 95% level using a two-tailed t test, transforming the remaining coefficients using the Fisher z transformation, averaging the corresponding z values, and transforming that average back to correlation coefficient. This procedure provides an appropriate average correlation coefficient (61). The result of the significance test is to increase the resulting correlation coefficients, as insignificant correlations tend to be close to zero; there are a few instances where no correlations passed the significance test, and, in those cases, the coefficient is set to zero.

