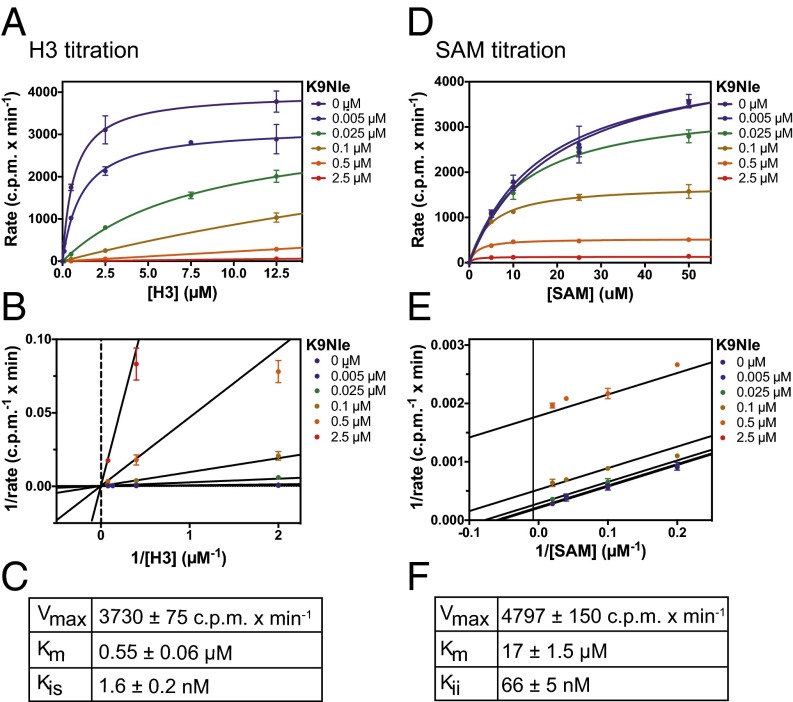
Fig. 4.
Kinetic analysis of G9a inhibition by K9Nle with regard to H3 and SAM dependency. (A–C) Steady-state kinetics of G9a–SET with constant SAM and titration of H31–20 unmodified peptide at different K9Nle peptide concentrations. Data are represented as a Michaelis–Menten plot (A) and a Lineweaver–Burk plot (B). Data were fitted (using nonlinear least squares) to the equation for competitive inhibition (black lines) and yielded a Kis of 1.6 ± 0.2 nM (C). Error bars represent SD of two replicates. (D–F) Steady-state kinetics of G9a–SET with constant H3 and titration of SAM at different K9Nle concentrations. Data are represented as a Michaelis–Menten plot (D) and a Lineweaver–Burk plot (E). Data were fitted (using nonlinear least squares) to the equation for uncompetitive inhibition (black lines) and yielded a Kii of 66 ± 5 nM (F). Error bars represent SD of two replicates.

