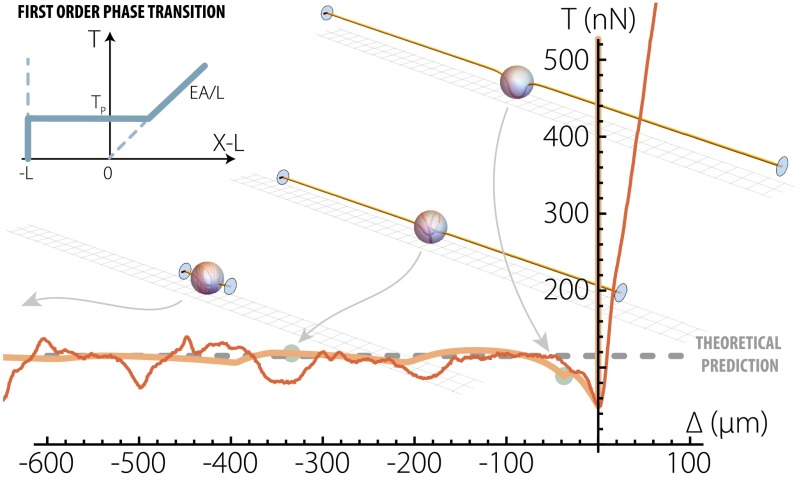
Fig. 4.
Structural phase transition and detailed mechanical response. Comparison between nano-Newton–resolved measurements on a composite polyurethane filament/silicone oil thread (red line), detailed simulations of an Elastica interacting with a droplet (orange line), and the first-order phase transition model (dashed gray line, full behavior also sketched in inset). Experiments were performed with a drop of wet length and a filament of radius and Young modulus MPa. Numerical equilibria are here followed with a continuation procedure, with and . The plateau tension given by the phase transition model 2 is here 115 nN. Beyond the nice overall agreement, the results reveal a difference between the buckling threshold and the plateau tension. This difference points to the subcritical nature of elastocapillary buckling, also evidenced by the sudden localization of the filament visible in the insets. The numerical simulations allow capture of the fine details in the micromechanical response observed in the experiments, resulting in inhomogeneities in the Maxwell plateau. Sensor drift forced us to adjust the reference level for the experimental measurements, but the level difference between buckling threshold and plateau tension is well recovered. See also Movies S4 and S5.

