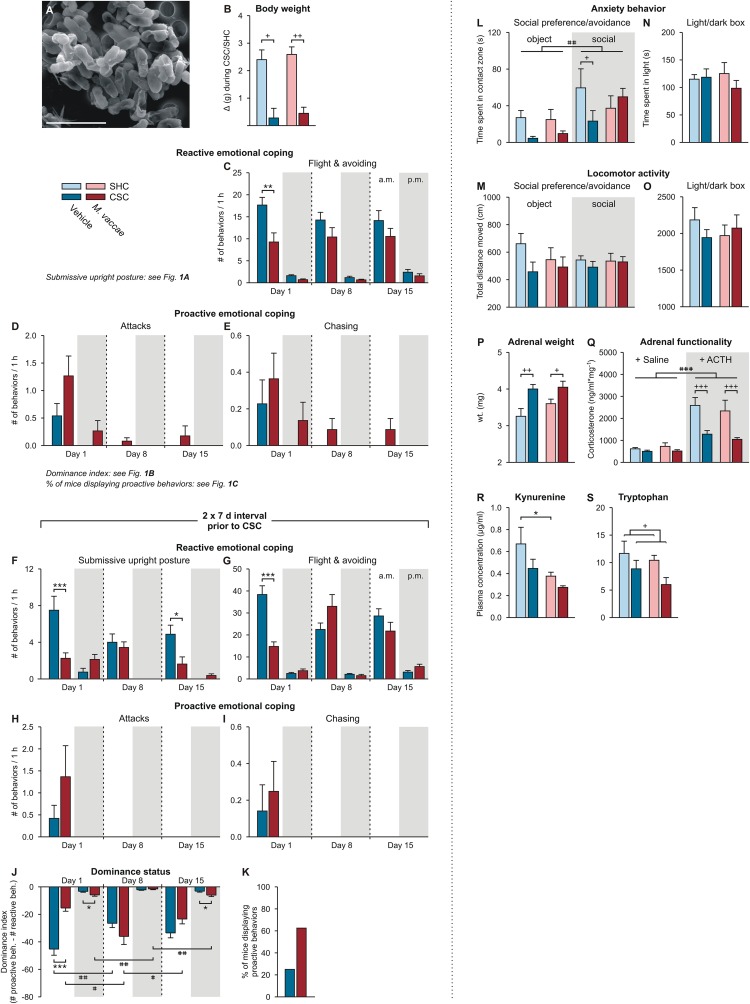
Fig. S2.
Behavioral and physiological data of Exps. 1–3. (A) Scanning electron microscopy image illustrating the heat-killed preparation of M. vaccae. (Scale bar, 3 µm.) (B) Effects of M. vaccae immunization on body weight gain during the 19-d single-housed control condition, or CSC exposure in Exp. 1. (C–E) Effects of M. vaccae or vehicle immunization on stress coping behavior during CSC exposure in Exp. 1, where CSC onset was initiated 1 wk following the final immunization with M. vaccae or vehicle. (C) Effects of M. vaccae immunization before CSC onset on the number of flight and avoiding behaviors, relative to vehicle-immunized controls, by CSC mice during the first hour (1000–1100 hours; white background) of CSC exposure on day 1 and during the first hour following exposure to a novel dominant male aggressor on days 8 and 15. Also shown are behavioral responses in the evening (1700–1800 hours; gray background) of days 1, 8, and 15. (D and E) The number of attacks (D) and number of chasing behaviors (E). (F–K) Effects of M. vaccae or vehicle immunization on stress coping behavior during CSC exposure in Exp. 2, where CSC onset was initiated 2 wk following the final immunization with M. vaccae or vehicle. Effects of M. vaccae immunization before CSC onset on the number of (F) submissive upright postures, (G) flight and avoiding behaviors, (H) number of attacks, and (I) number of chasing behaviors. (J) Dominance index. (K) Percent of vehicle- and M. vaccae-immunized mice displaying proactive behaviors during the 19-d CSC procedure. (L–Q) Behavioral end points from Exp. 3. (L) Time spent in the contact zone during the object and social phases of the social preference/avoidance test (day 21). (M) Locomotor activity during the SPAT. (N) Time spent in the light compartment during the light/dark box test (day 20). (O) Locomotor activity during the LDB test. (P–S) Additional physiologic end points from Exp. 1, collected on day 20. (P and Q) Effects of M. vaccae immunization and CSC on adrenal weight and functionality. (P) Adrenal weight measured on day 20. (Q) In vitro adrenal functionality assessed by corticosterone secretion following stimulation with saline or adrenocorticotropic hormone on day 20. (R and S) Blood samples were collected on day 20 and plasma (R) l-kynurenine and (S) l-tryptophan concentrations were measured using high-performance liquid chromatography with electrochemical detection. Bars represent means; error bars represent +SEM. Significance was assessed by (B, N–P, R, and S) two-factor ANOVA, (C–J) LMM, conducted separately for AM and PM time points, (K) Fisher’s exact test, (L and M) LMM, and (Q) three-factor ANOVA. *P < 0.05, **P < 0.01, ***P < 0.01, between-subjects effects of M. vaccae versus vehicle, Fisher’s least significant difference (LSD) tests; +P < 0.05, ++P < 0.01, +++P < 0.001, between-subjects effects of CSC versus SHC; #P < 0.05, ##P < 0.01, within-subjects effects of time, paired t tests using Bonferroni correction. (Q) ###P < 0.001, main effect of ACTH versus saline (three-factor ANOVA). The number of independent data points (N) in each of the graphs (B–S) and sample size (n) for each group are as follows: (B) N = 63; vehicle/SHC, 9; vehicle/CSC, 22; M. vaccae/SHC, 9; M. vaccae/CSC, 23. (C) N = 46; vehicle, 23; M. vaccae, 23. (D and E) N = 46; vehicle, 22–23; M. vaccae, 22–23. (F, H, and I) N = 16; vehicle, 7–8; M. vaccae, 7–8. (G, J, and K) N = 16; vehicle, 8; M. vaccae, 8. (L–O) N = 30; vehicle/SHC, 8; vehicle/CSC, 7 (object), 8 (social); M. vaccae/SHC, 6 (object), 7 (social); M. vaccae/CSC, 7 (object), 8 (social). (P and Q) N = 34; vehicle/SHC, 9; vehicle/CSC, 8; M. vaccae/SHC, 9; M. vaccae/CSC, 8. (R) N = 30; vehicle/SHC, 9; vehicle/CSC, 7; M. vaccae/SHC, 9; M. vaccae/CSC, 5. (S) N = 30; vehicle/SHC, 9; vehicle/CSC, 7; M. vaccae/SHC, 9; M. vaccae/CSC, 6.

