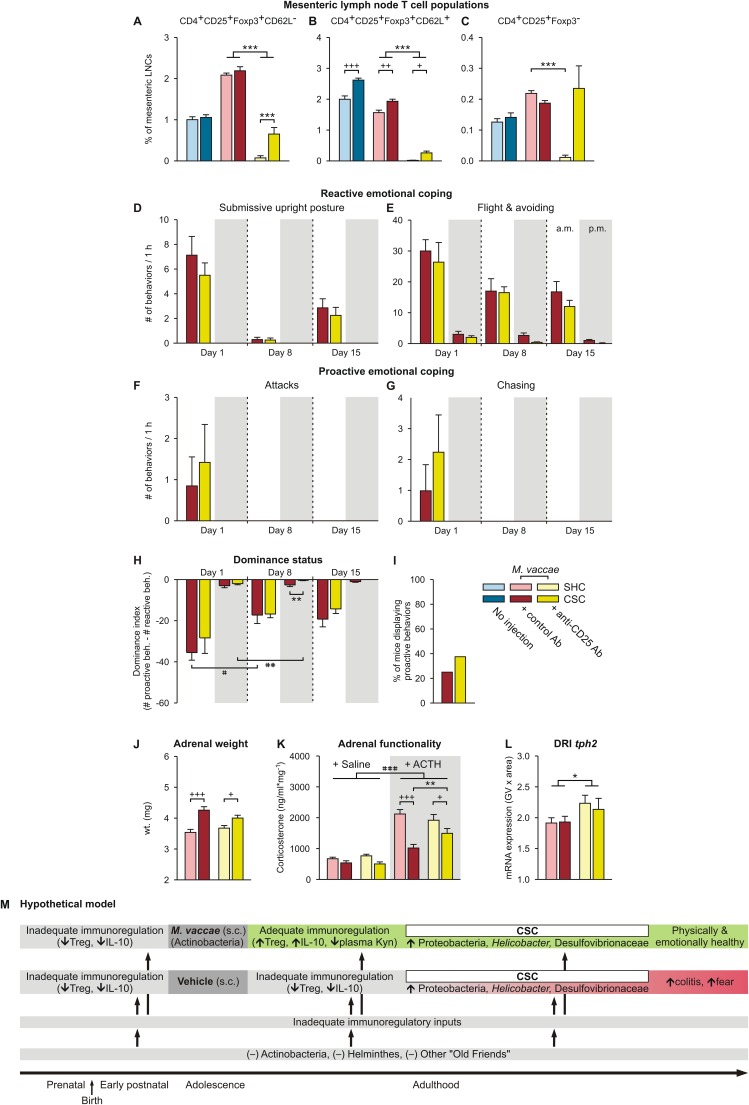
Fig. S6.
Data of Exp. 3 showing physiologic and behavioral responses to chronic psychosocial stress and a hypothetical model for mechanisms underlying the promotion of stress-resilience effects following M. vaccae immunizations. (A–C) Effects of M. vaccae, CSC, and anti-CD25 antibody treatment on T helper cells. (A–C) Effects of anti-CD25 antibody, versus control antibody, administration on day –4 on mesenteric lymph node T-cell populations were evaluated using flow cytometry on day 20. (Left) Data for uninjected controls, for comparison. CD4+CD25+FoxP3+ regulatory T cells restrain the immune responses to self-antigens, pathogens, allergens, and commensal microorganisms. (A) CD62L− Treg. (B) CD62L+ Treg. (C) CD4+CD25+Foxp3− effector T cells. (A–C) Treatment with anti-CD25 antibodies successfully depleted CD25+ cells in mesenteric lymph nodes of M. vaccae-immunized SHC mice (>95% depletion in all cases). However, in M. vaccae-immunized CSC-exposed mice, a considerable number of CD25+ cells were still detectable. (A and B) CD4+CD25+FoxP3+CD62L− Treg (A) as well as CD4+CD25+FoxP3+CD62L+ Treg (B) were reduced only by 70.3% and 86.5%, respectively, presumably because the 19-d CSC exposure induced Treg following the initial depletion, a depletion that remains evident in SHC mice. CD25 is also expressed on CD4+ effector cells. For CD4+CD25+FoxP3−CD62L− effector cells, the bias in efficiency of depletion in M. vaccae-immunized SHC versus CSC mice was even more prominent. (C) Whereas CD4+CD25+FoxP3−CD62L− cells were successfully depleted in SHC mice (95.5% depletion), no reduction was seen in M. vaccae-immunized CSC mice (126.3% of control values). CSC exposure in M. vaccae-immunized mice either prevented CD25+ cells from depletion or activated a yet unknown pathway that led to a specific increase in CD25+ T helper cells. The latter is in line with our previous observations that CSC induced unspecific T-cell activation leading to increased production of effector cytokines by in vitro activated T cells (132). (D–I) Effects of anti-CD25 antibody treatment on reactive versus proactive coping responses in M. vaccae-immunized mice. (D) Effects of treatment with an anti-CD25 antibody, relative to treatment with a control antibody, on day –4, on the number of submissive upright posture displays, during the first hour (1000–1100 hours; white background) of CSC exposure on day 1 and during the first hour following exposure to a novel dominant male aggressor on days 8 and 15. Also shown are behavioral responses in the evening (0500–0600 hours; gray background) of days 1, 8, and 15. (E–G) Effects of anti-CD25 antibody or control antibody treatment on the number of (E) flight and avoiding behaviors, (F) attacks, and (G) chasing behaviors during CSC exposure. (H) Dominance index scores (number of proactive behaviors minus the number of reactive behaviors) of anti-CD25– and control antibody-treated mice during the 19-d CSC procedure. (I) Percent of anti-CD25– and control antibody-treated mice that displayed proactive behaviors (attack, chase) during the 19-d CSC procedure. (J) Adrenal weight measured on day 20. (K) In vitro adrenal functionality measured on day 20. (L) tph2 mRNA expression in the interfascicular part of the dorsal raphe nucleus (DRI). (M) Hypothetical model illustrating how M. vaccae immunization counteracts disease vulnerability. Inadequate immunoregulatory inputs during the pre- and postnatal periods, during adolescence, as well as during adulthood, led to increased vulnerability to stress-induced spontaneous colitis and exaggerated stress-induced fear responses. Immunization with M. vaccae restores immunoregulation that protects against stress-induced spontaneous colitis and exaggerated fear responses, despite a stress-induced transition to a colitogenic microbial gut milieu. Kyn, l-kynurenine. Bars represent means; error bars represent (A–G and J–L) +SEM or (H) −SEM. Data were analyzed using (A–C, J, and L) two-factor ANOVA for between-subjects designs or by (D–H) LMM, conducted separately for AM and PM time points, (I) Fisher’s exact test, or (K) three-factor ANOVA. Post hoc comparisons were made using Fisher’s LSD tests. *P < 0.05, **P < 0.01, ***P < 0.001, anti-CD25– versus control antibody-treated mice; +P < 0.05, ++P < 0.01, +++P < 0.001, CSC versus SHC; #P < 0.05, ##P < 0.01, ###P < 0.001, within-subjects effects of (H) time, paired t tests using Bonferroni correction, or (K) main effect of ACTH. The number of independent data points (N) in each of the graphs and sample size (n) for each group are as follows: (A–C) N = 48; uninjected/SHC, 8; uninjected/CSC, 8; vehicle/SHC, 8; vehicle/CSC, 8; M. vaccae/SHC, 8; M. vaccae/CSC, 8. (D–L) N = 32; vehicle/SHC, 8; vehicle/CSC, 8; M. vaccae/SHC, 8; M. vaccae/CSC, 8; vaccae/CSC, 8.

