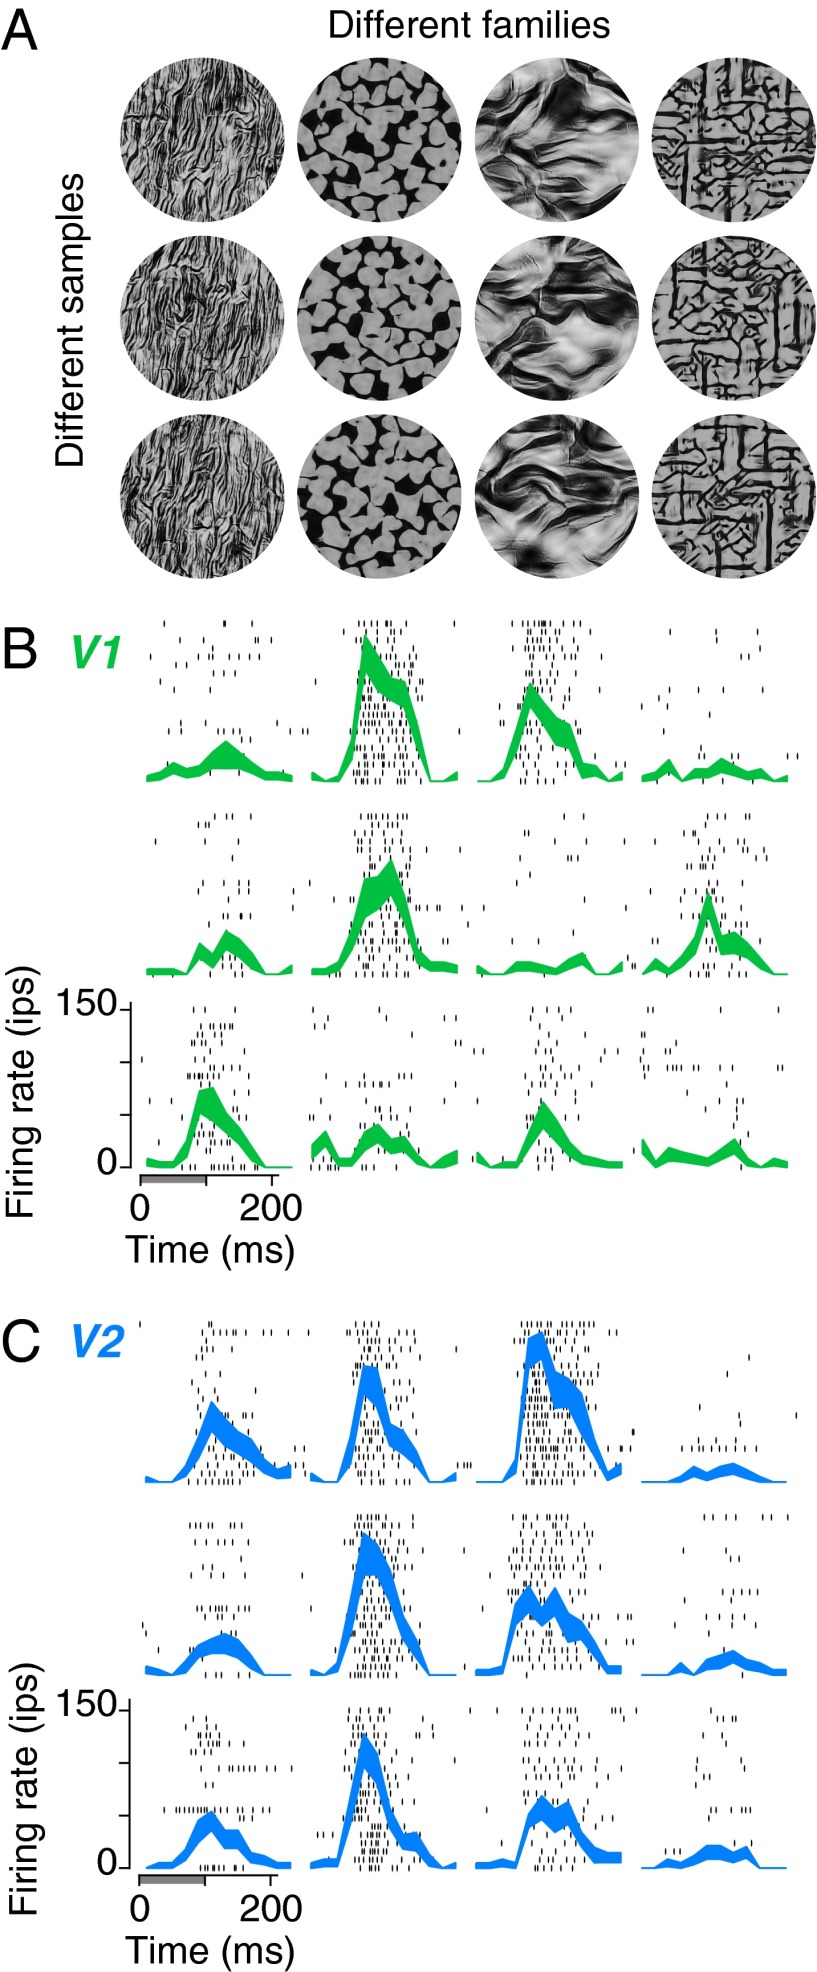
Fig. 1.
Examples of texture stimuli and responses of V1 and V2 neurons. (A) Naturalistic textures. Each column contains three different samples from each of four texture families. The samples within each family are statistically matched, but differ in detail because the synthesis procedure is initialized with independent images of Gaussian white noise. (B) Raster plots and mean firing rates for an example V1 neuron, responding to textures in A. The gray bar indicates presentation of the stimulus (first 100 ms), and each row of black ticks represents the timing of spikes on a single presentation of the stimulus. The thickness of the lines indicates SEM across 20 repetitions of each of the images in A. (C) Same as in B, for an example V2 neuron.

