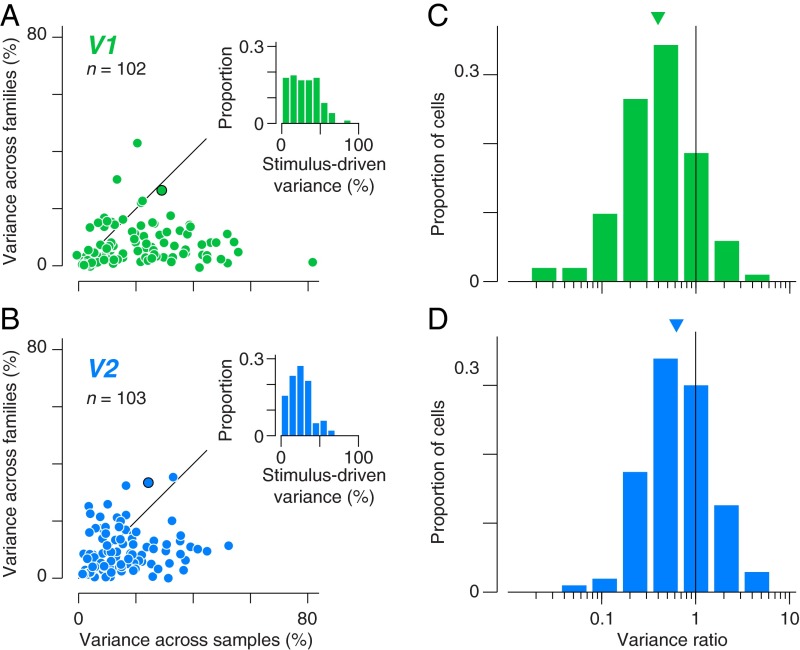
Fig. 2.
Nested ANOVA analysis of single-unit responses in V1 and V2. (A and B) Response variance of single units in V1 and V2 is partitioned into a component across families, a component within families (across samples), and a residual component across stimulus repetitions (noise). The position of each point indicates, for a single neuron, the percentage of variance corresponding to the first two of these components. (Insets) Distribution of the sum of these first two components. Points outlined in black correspond to the example single units shown in Fig. 1. (C and D) Distributions of the ratio of across-family to across-sample variance for V1 and V2. The geometric mean variance ratio was 0.4 in V1 and 0.63 in V2 (indicated by triangles). The difference was significant (P < 0.001, t test in the log domain).

