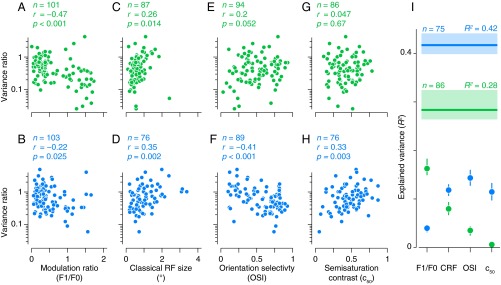
Fig. 3.
Dependence of response tolerance on conventional receptive field properties. (A–H) Variance ratio (as in Fig. 2) plotted against receptive field properties of individual V1 (green) and V2 (blue) neurons. (I) Results of multiple linear regression of the variance ratio against the four receptive field properties highlighted in A–H. Horizontal lines show total explained variance for V1 (green) and V2 (blue). Points represent the contribution to the explained variance of different receptive field properties determined using the averaging-over-orderings technique (28). Shaded regions and error bars represent 95% confidence intervals computed using jackknife resampling.

