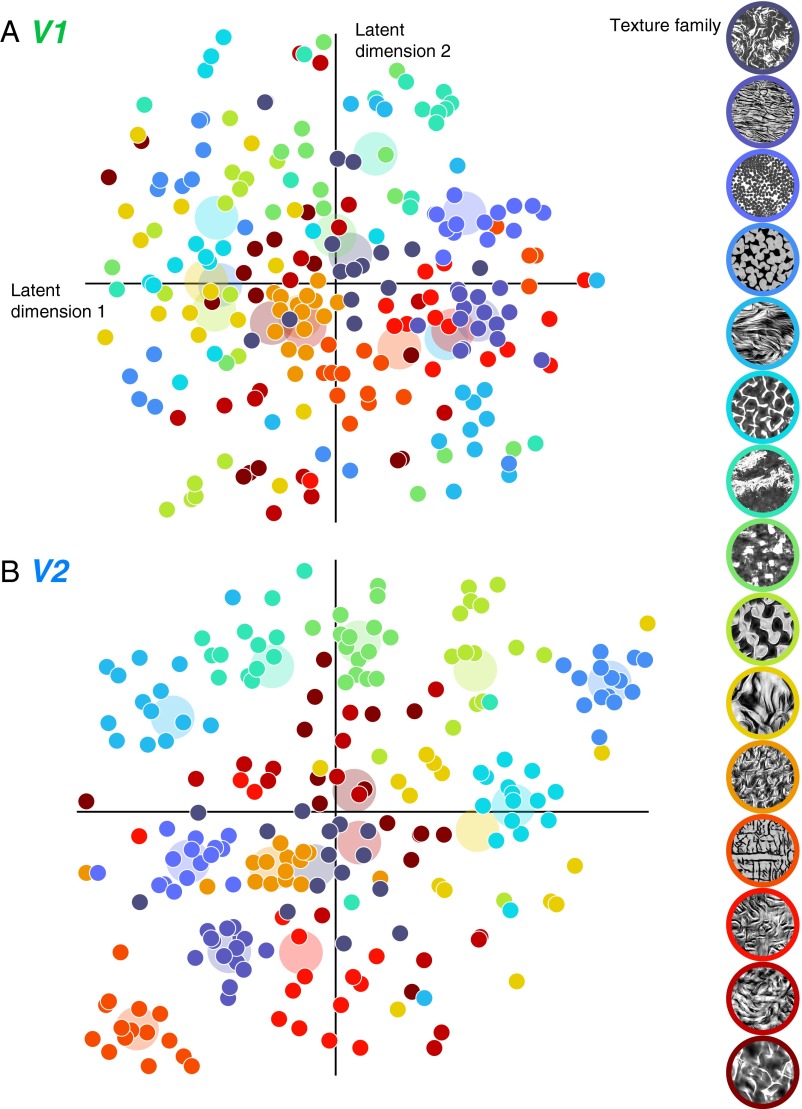
Fig. 4.
Two-dimensional visualization of neural population responses in V1 and V2. (A) V1 population response to each visual texture stimulus, displayed in a 2D coordinate system that captures the responses of 102 V1 neurons [computed using t-SNE (30)]. Each point represents one texture image, with color indicating the texture family. The larger, desaturated disks in the background indicate the centroid of all samples within each family. (B) Same analysis for the responses of 103 V2 neurons.

