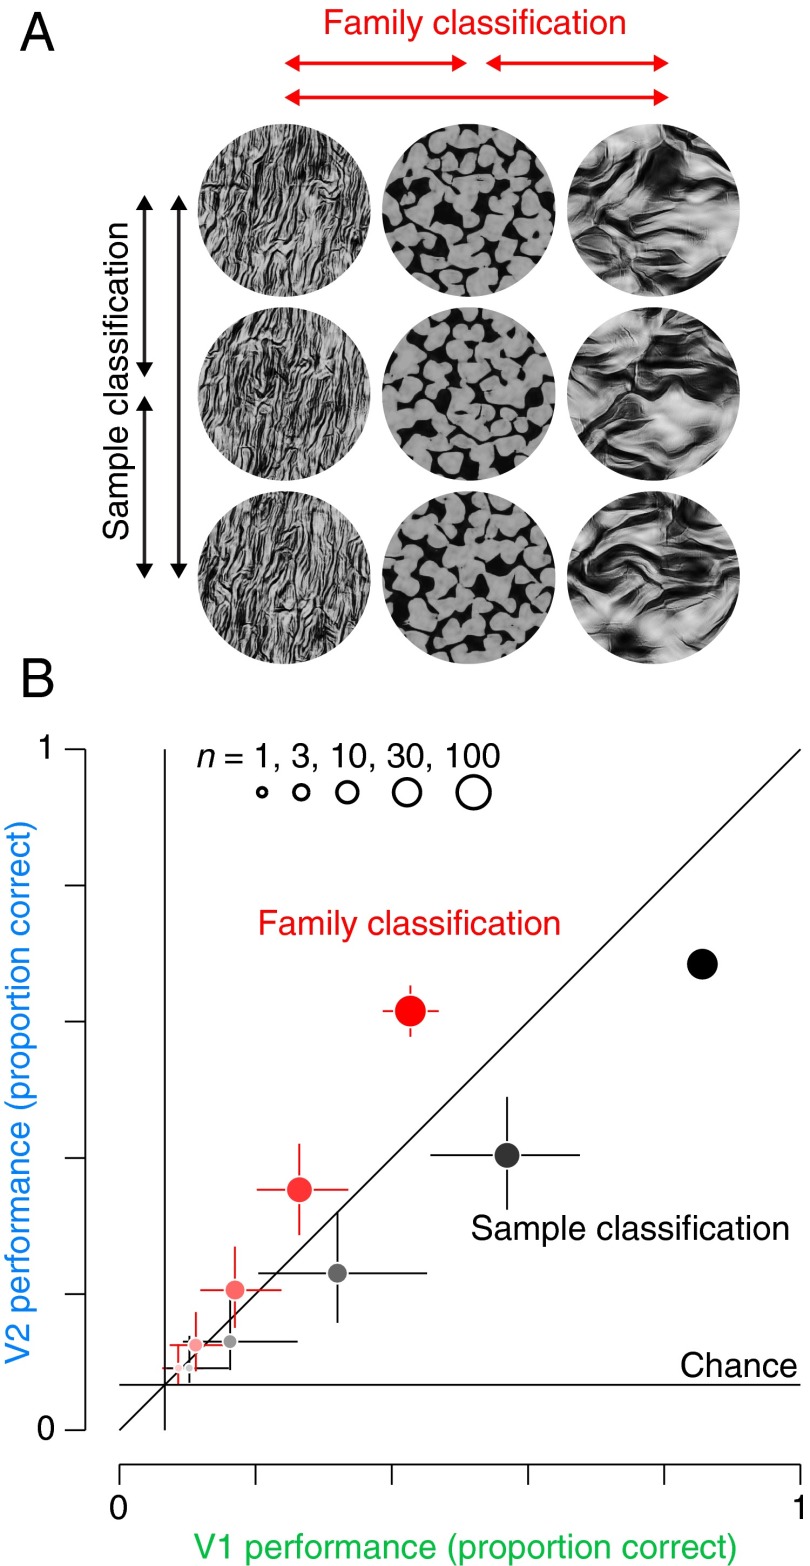
Fig. 5.
Quantifying representational differences between V1 and V2. (A) Schematic of sample (black) and family (red) classification. For sample classification, holdout data were classified among the 15 different samples for each family. Performance for each of the families was then averaged together to get total performance. For family classification, the decoder was trained on multiple samples within each family, and then used to classify held out data into each of the 15 different families. (B) Comparison of proportion of correct classification of V1 and V2 populations for family classification (red) and sample classification (black). We computed performance measures for both tasks using five different population sizes, indicated by the dot size (n = 1, n = 3, n = 10, n = 30, and n = 100). Chance performance for both tasks was 1/15. Error bars represent 95% confidence intervals of the bootstrapped distribution over included neurons and cross-validation partitioning.

