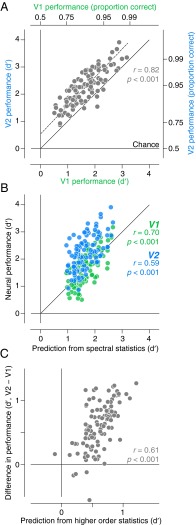
Fig. 6.
Texture discrimination performance of neural populations. (A) Comparison of V1 and V2 performance on pairwise texture discrimination. Performance values were plotted on coordinates that varied linearly in discriminability (d′). The right and top axes indicate corresponding values of performance expressed as the proportion correct. Each point represents one of 105 pairwise comparisons among the 15 texture families. The dashed line indicates the best fit using total least squares. (B) Comparison of V1 and V2 performance with the performance of a model capturing spectral statistics. The magnitude of difference in spectral statistics for each texture family pair was weighted to account best for the performance of V1. Both V1 performance and V2 performance were plotted against this spectral prediction. (C) Comparison of the difference in V1 and V2 performance with the strength of higher order correlation differences. The magnitude of difference in higher order correlations for each texture family pair was weighted to predict best the difference in V1 and V2 performance.

