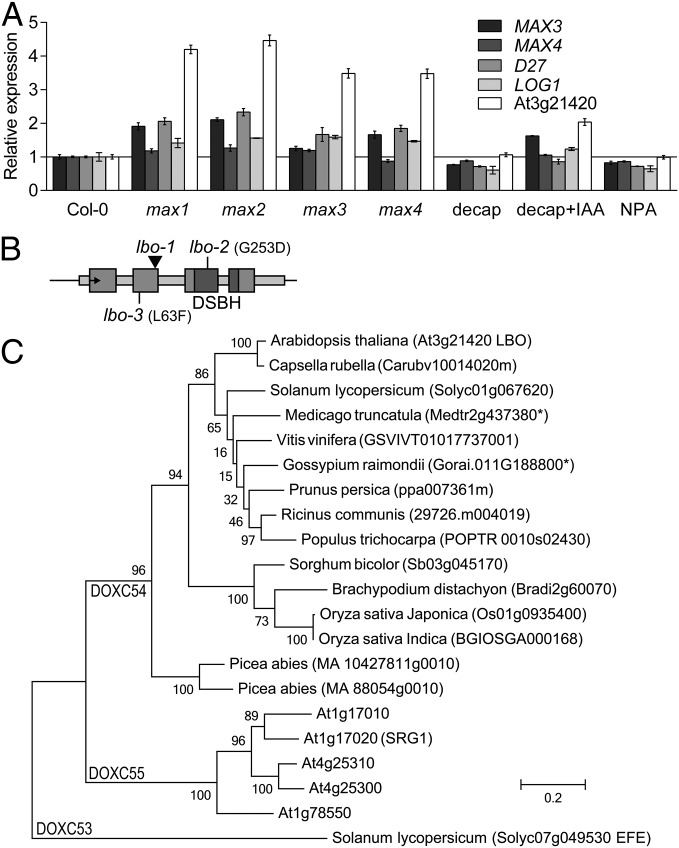
Fig. 2.
Discovery of the LBO gene by reverse genetics. (A) Expression from microarray data revealed genes that followed the distinctive pattern (41) of the MAX3 gene in hypocotyls dissected from soil-grown WT, max mutants, decapitated WT (decap) with or without apical auxin [indole-3-acetic acid (IAA)] added, or WT with N-1-naphthylphthalamic acid (NPA) applied locally beneath the rosette. This group included D27, LONELY GUY1 (LOG1), and an uncharacterized gene At3g21420 (LBO). Microarray expression values are relative to untreated Col-0. Mean ± SEM (n = 2–3; 120–150 hypocotyls per replicate). (B) Diagram representing the DNA sequence of the LBO locus. The arrow points to the start codon, exons are large boxes, and introns and untranslated regions are narrow boxes. The promoter region spans 3,627 bp to the next gene, and 1,711 bp were used for GUS expression. The positions of the FLAG_119G09 line T-DNA insert (lbo-1; arrowhead), other point mutation alleles (lbo-2 and lbo-3), and the double-stranded β-helix conserved catalytic domain (DSBH) are shown. (C) A phylogenetic tree of 2OGD amino acid sequences from 2OGD clade DOXC54 (25) from prominent species reveals the similarity of At3g21420 (LBO). For reference, the Arabidopsis sequences from the next nearest clade (DOXC55) and the nearest similar sequence with reported functional characterization, ETHYLENE FORMING ENZYME (EFE) from tomato (Solanum lycopersicum) in clade DOXC53, are included. Bootstrap values are shown for each branch. Units are amino acid substitutions per site. *Existence of a splice variant.

