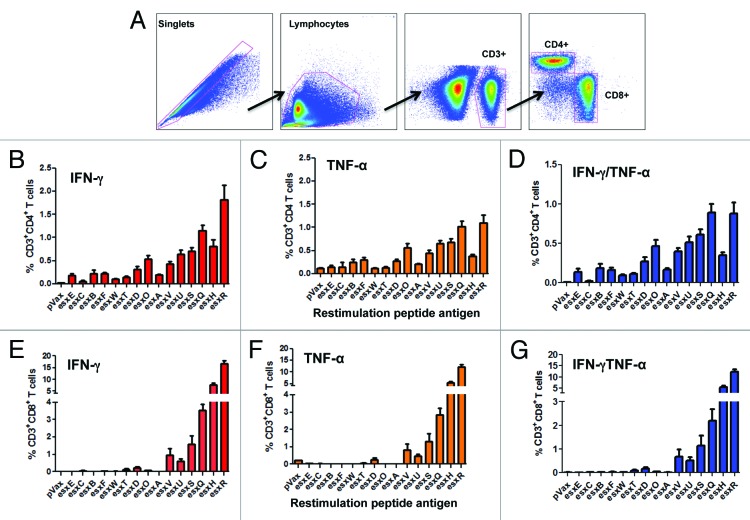
Figure 3. Evaluation of the esx-specific CD4 and CD8 T cells responses following DNA vaccination. CB6F1 mice (n = 5) were immunized by i.m./EP with 3 injections at 2-wk intervals with 20 µg of each individual esx construct. Splenocytes were collected 1 wk after final vaccination, stimulated with their respective peptide pools and analyzed by flow cytometry following intracellular staining using antibodies against IFN-γ and TNF-α. (A) The gating strategy used to analyze the frequency of CD4 and CD8 T cells positive for IFN-γ and TNF-α cytokines. (B) Column graphs depicting esx-specific CD4 T cells releasing the cytokines IFN-γ (C) TNF-α and (D) double-positive producing cells (and pVAX control). (E) Column graphs show the esx-specific CD8 T cells releasing the cytokines IFN-γ (F) TNF-α and (G) double-positive producing cells (and pVAX control). Background staining from cells stimulated with medium alone has been subtracted. Error bars represent SEM of 5 mice per group. Experiments were performed independently at least 2 times with similar results.

An official website of the United States government
Here's how you know
Official websites use .gov
A
.gov website belongs to an official
government organization in the United States.
Secure .gov websites use HTTPS
A lock (
) or https:// means you've safely
connected to the .gov website. Share sensitive
information only on official, secure websites.
