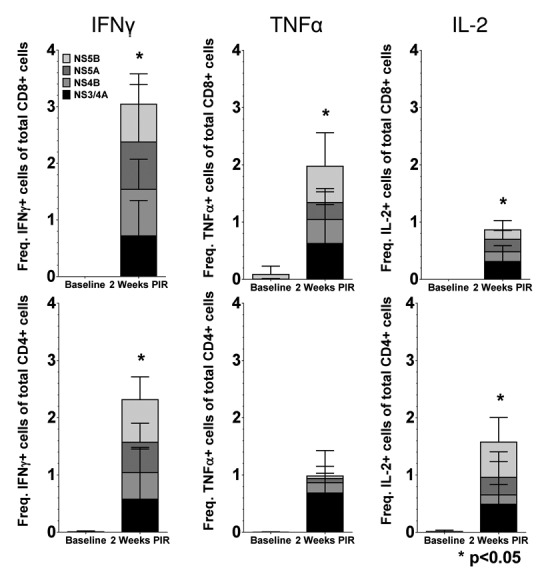
Figure 5. Cytokine production of HCV-specific T cells following immunization. Mean frequencies of cytokine-positive Th1 and CTL cells stacked by HCV antigen at 2 wk PIR compared with baseline (■, NS3/4A; ■, NS4B; ■, NS5A; ■, NS5B). Total responses were denoted as significant by paired Student t test, if responses to each individual antigen were significant (P < 0.05), as compared with baseline samples.
