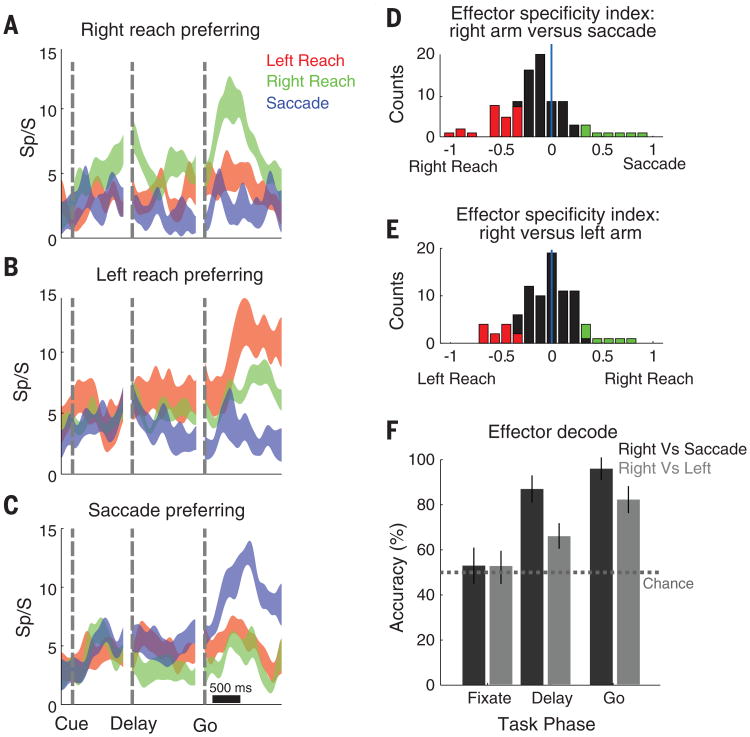
Fig. 4. Effector specificity in PPC.
(A) Unit showing preferential activation to imagined movements of the right arm. Each trace shows the neural firing rate (mean ± SE) for the movement direction evoking the maximal response for each effector. (B and C) Same as (A), but for left arm and saccade-preferring neurons. (D) Population analysis. The degree of effector specificity varied across the population. Effector specificity was quantified with a specificity index based on the normalized depth of modulation (DM) for reaches versus saccades . The specificity index for units that were spatially tuned to at least one effector is shown as a histogram. Colored bars indicate a significant preference for an effector. (E) Same as (D) but for imagined right arm versus left arm movements. (F) The effector used to perform the task could be decoded from the neural population (mean with 95% CI).

