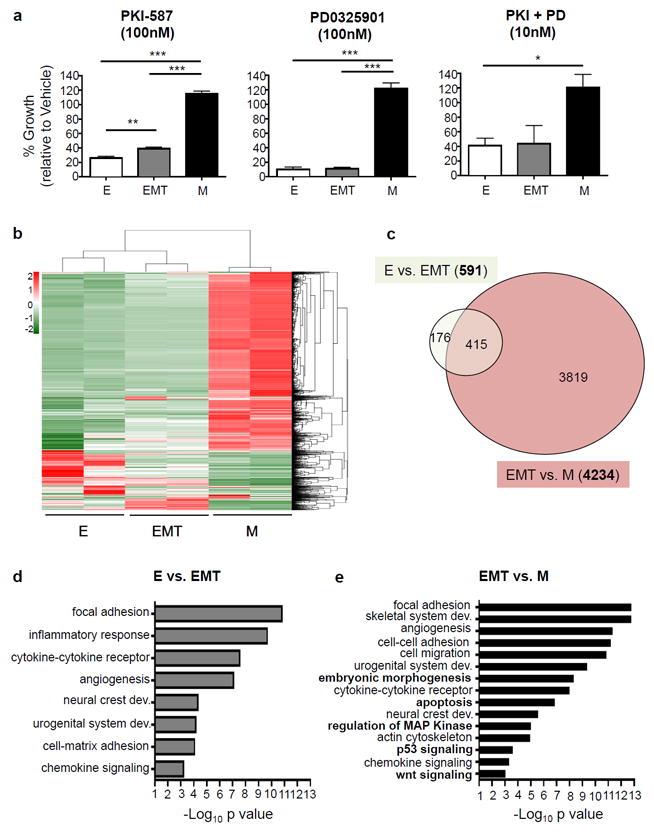
Figure 2. Epithelial-mesenchymal transition states dictate response to PI3K and MAPK pathway inhibition and differential gene expression profile.

(a) PKV cells were treated with vehicle alone (DMSO), the PI3K/mTOR inhibitor PKI-587 (100nM), the MEK inhibitor PD0325901 (100nM), or both (10nM for each) for 7 days. MES-like (M) tumor cell growth is unaffected by treatment with PI3K and MAPK pathway inhibitors. % growth is relative to vehicle-treated cells (DMSO). (b) The gene transcription profiles of epithelial (E), EMT, and MES-like (M) tumor cells isolated from the prostates of 10-12 week old CPKV mice as assessed by RNA-seq. Heatmap displays mean-centered gene transcription levels of 2190 genes with average FPKM no less than 0.01 and coefficients of variation higher than 0.5. (c) Venn diagram showing the overlap of differentially expressed genes (DEGs) between epithelial vs. EMT (E vs. EMT) and EMT vs. MES-like populations (EMT vs. M). The MES-like tumor cell population has a large number of DEGs compared to the EMT (4234) tumor cell population. (d) Significantly enriched Gene Ontology (GO) items for differentially transcribed genes between epithelial (E) and EMT tumor cell populations. (e) Significantly enriched GO items for differentially transcribed genes between EMT and MES-like (M) tumor cell populations. Items in bold are solely enriched in the EMT-M transition. Data in a is represented as mean ± SEM from 3 independent experiments done in triplicate. *, p<0.05; **, p<0.01; ***, p<0.001.
