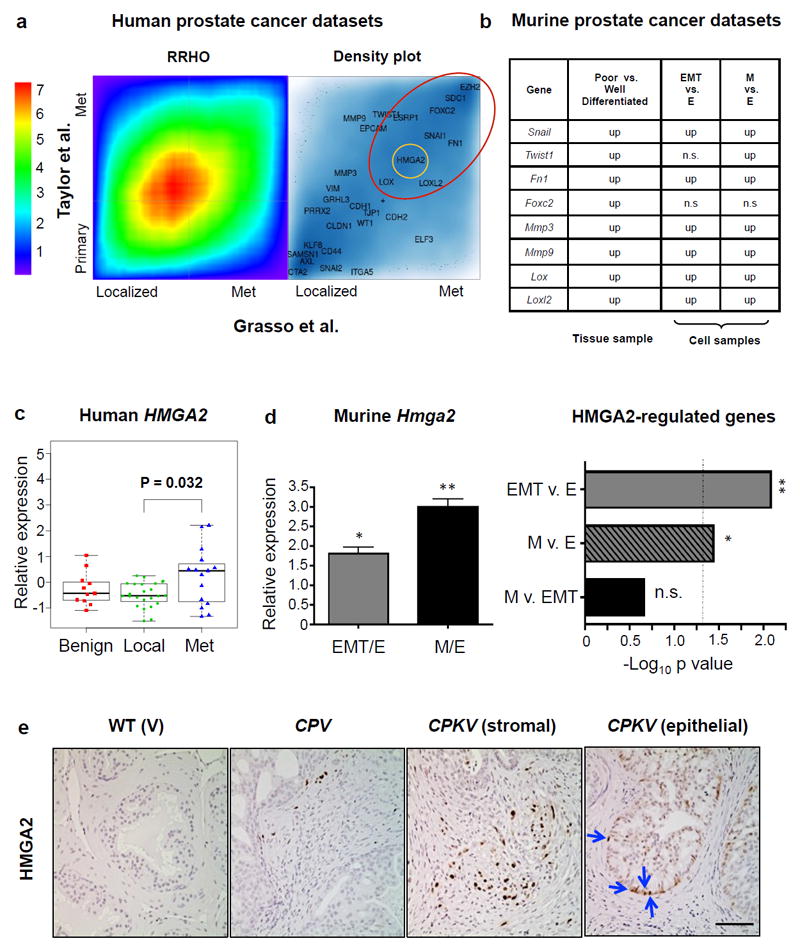
Figure 3. HMGA2 is highly expressed in human mCRPC and in murine EMT and mesenchymal-like tumor cells.

(a) Heat map comparing the overlap of differentially expressed genes in primary/localized and metastatic (met) prostate tumor specimens from the Taylor et al.7 and Grasso et al.18 human prostate cancer datasets based on rank-rank hypergeometric overlap (RRHO) analysis used to measure and visualize the degree of statistically significant overlap between two expression datasets (Left Panel). The color bar indicates the transformed log10 hypergeometric enrichment p-value between two ordered gene sets. The high heat area along the diagonal indicates significant overlap in differentially expressed genes between the two human prostate cancer datasets. Right Panel, selected epithelial and EMT signature genes were plotted corresponding to their signed and logged p-value ranks based on differential expression between metastatic and primary cancer samples. The depth of the blue color represents the density of all genes. A number of EMT signature genes (large red circle) were consistently ranked at similar positions in both human prostate cancer datasets. HMGA2 (small yellow circle) was among the group of genes differentially expressed in metastatic prostate cancer in both human datasets. (b) EMT genes upregulated in human metastatic prostate cancer were differentially expressed in murine datasets obtained from 1) laser capture microdissection microarray analysis of prostate tissue samples (p<0.05) and 2) RNA-seq analysis of FACS sorted cell populations (FDR<0.05). EMT genes were often upregulated in poorly differentiated prostate tissue and in EMT and MES-like (M) tumor cells. Up, upregulated; n.s., not significant. (c) HMGA2 expression levels in benign, localized (local), and metastatic CRPC (met) patient samples from Grasso et al.18 reveals that HMGA2 expression is significantly upregulated in mCRPC compared to localized disease. (d) Hmga2 expression is significantly upregulated in EMT and MES-like (M) tumor cells compared to epithelial tumor cells (Left Panel). Data was combined from 3 independent experiments done in triplicate. Right Panel, Fisher’s exact test was used to assess enrichment of HMGA2-regulated genes27 in differentially expressed genes between the EMT vs. epithelial (EMT v. E) and MES-like vs. epithelial (M v. E) tumor cell populations. Dotted line, p-value= 0.05; n.s, not significant. (e) HMGA2 protein expression is highly induced in both the stroma and epithelium (arrows) of CPKV prostates compared to CPV and V prostates. Scale bar, 50 μm. Data in c and d are represented as mean ± SEM. *, p<0.05; **, p<0.01.
