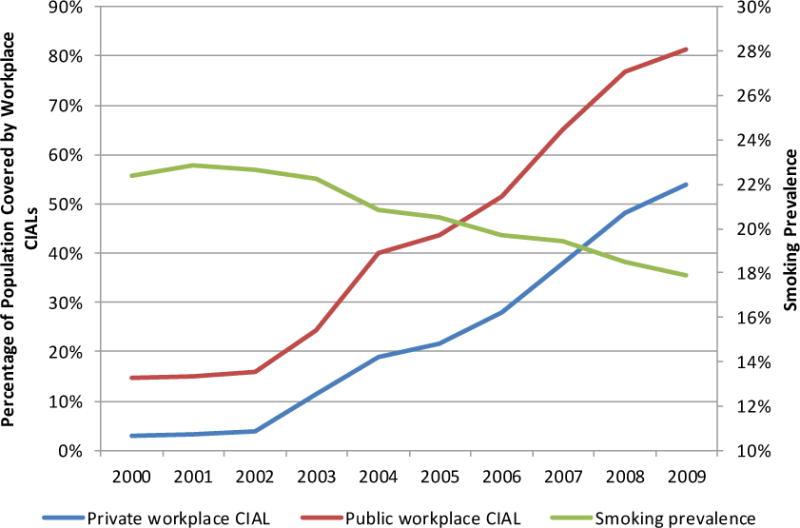
Figure 1. Trend of proportion of population covered by workplace CIALs in state, county, and city levels and smoking prevalence, 2000–2009.

Source: Authors’ computation using data from American Nonsmokers’ Rights Foundation, the Census-Estimated Population (CEP) Cities and Towns, Behavioral Risk Factor Surveillance System, and Tobacco Use Supplements to Current Population Survey.
