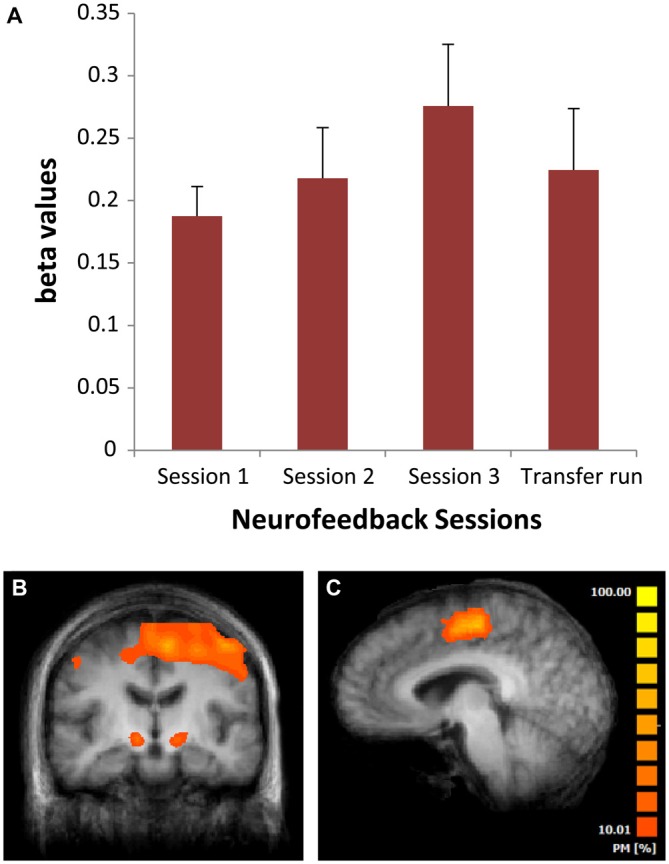
Figure 4.

(A) Mean beta values from the neurofeedback (NF) scans for the three different sessions in weeks 2, 6 and 12 of the NF intervention. Bars are standard errors; (B) Areas of significant activation across all NF sessions (whole brain based analysis). (C) Sagittal view of the brain showing a probabilistic map of the overlap across regions of interest (ROI’s) supplementary motor area (SMA) used for NF training across patients. PM, probabilistic map.
