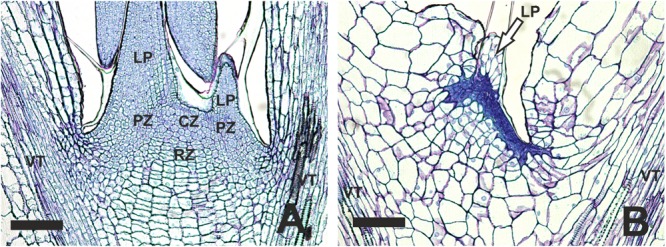
FIGURE 3.

Histological differences observed in the SAM area of B. oleracea (Line AG5010) seedlings at 6 days after the induction treatment. (A) Seedling with a non-blind phenotype. (B) Seedling with a blind phenotype. CZ, Central zone; LP, Leaf primordium; PZ, Peripheral zone; RZ, Rib zone; VT, Vascular tissue reaching into the cotyledons. In (B) the arrow points to what may be the remnants of a leaf primordium initiated during seed development. The scale bars represent 100 μm.
