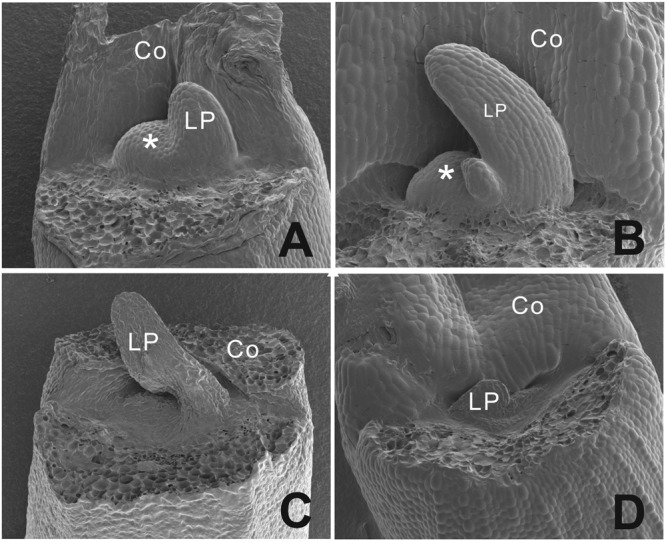
FIGURE 4.

Scanning electron microscopy picture of the phenotypic difference between a functional normal and arrested SAM in B. oleracea seedlings from cultivar Stanton F1. (A) Three days old seedlings with a functional normal SAM and one leaf developing. (B) Four days old seedling with one leaf emerging and functional normal SAM. (C) Three days old seedling with an aberrant SAM area and one leaf-like structure. (D) Four days old seedling with an aberrant SAM area. Asterisks indicate the SAM, Co, cotyledons; LP, leaf primordium.
