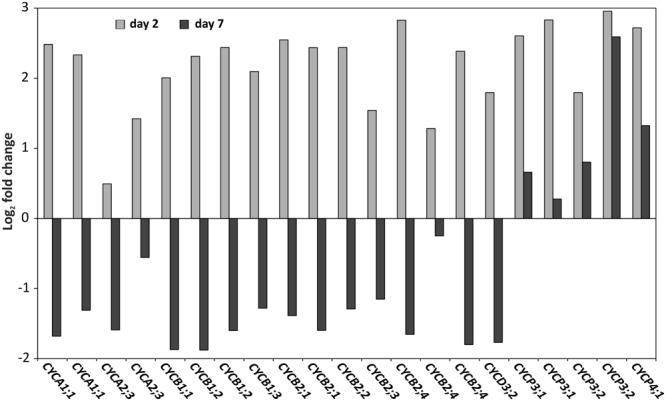
FIGURE 8.

Cyclins are inversely differentially expressed at days 2 and 7. Log2 expression fold change of cyclin genes: CYCA1;1 (gBol021328, gBol043233/AT1G44110.1),CYCA2;3 (gBol038155, gBol009873/AT1G15570.1),CYCB1;1 (gBol028907/AT4G37490.1),CYCB1;2 (gBol024500,gBol015440/AT5G06150.1),CYCB1;3 (gBol023203/AT3G11520.1),CYCB2;1 (gBol012439, gBol007505/AT2G17620.1),CYCB2;2 (gBol018699/AT4G35620.1) CYCB2;3 (gBol006997/AT1G20610.1), CYCB2;3 (gBol006997/AT1G20610.1), CYCB2;4 (gBol039865, gBol015175, gBol027646/AT1G76310.1), CYCD3;2 (gBol027246/AT5G67260.1), CYCP3;1 (gBol029526,gBol030150/AT2G45080.1), CYCP3;2 (gBol045616,gBol001087/AT3G60550.1) and CYCP4;1 (gBol029520/AT2G44740.1). Day 2 (gray) is the comparison between the samples of the induced sensitive (AG5010) compared to the induced resistant seedlings (AG1020). Day 7 (black) is the comparison between samples of the induced sensitive (AG5010) blind and induced sensitive non-blindnormal (AG5010) seedlings.
