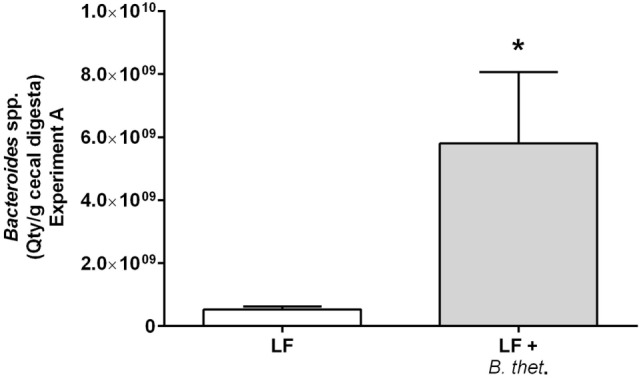
Figure 3.

The prevalence of Bacteroides spp. in the cecal digesta of low-fat (LF) fed animals in Experiment A quantified by qPCR. The values are mean quantity per gram wet weight with SEM represented by vertical bars (n = 3). The significant difference is marked with an asterisk: *p < 0.05 (one-way ANOVA). B. thet., Bacteroides thetaiotaomicron; LF, low-fat diet; qPCR, quantitative polymerase chain reaction; SEM, standard error of the mean.
