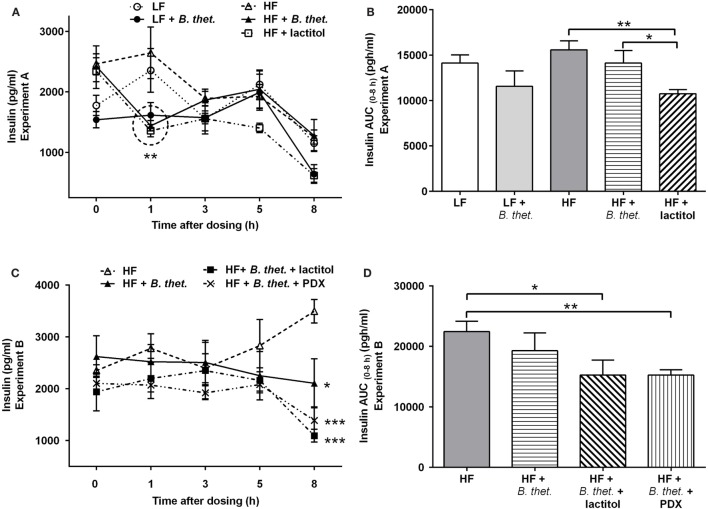
Figure 6.
Postprandial plasma insulin concentrations (picogram/milliliter) during the last experimental day, expressed separately for Experiments A (A) and B (C). The areas under the curve (AUC) for insulin concentrations in both experiments are expressed in (B,D). The AUC values (0–8 h after the last dose) were calculated using the trapezoidal rule. The values are means with SEM represented by vertical bars (n = 4–5). The significant differences are compared to the HF control group (-Δ-) at the same time point or between the indicated groups and marked with asterisks: *p < 0.05, **p < 0.01, and ***p < 0.001 (two-way ANOVA for insulin concentrations and Student’s t-test for AUC). In figure (A), the statistically significant values are marked with a circle. B. thet., Bacteroides thetaiotaomicron; HF, high-fat diet; LF, low-fat diet; PDX, polydextrose; SEM, standard error of the mean.

