
FIGURE 5.
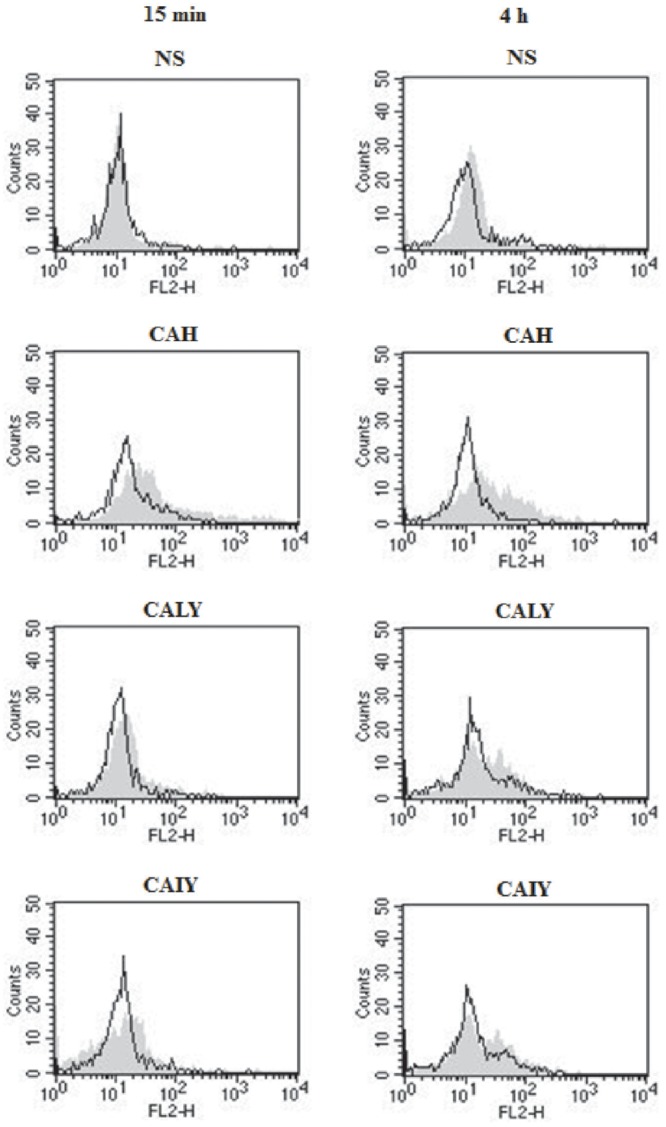
Flow-cytometry analysis of pNF-κB. PMNs, pre-treated or not with NF-κB inhibitor (2.5 μM), were incubated without stimuli (NS) or with C. albicans hyphae (CAH), live yeast (CALY) or heat inactivated yeast (CAIY) for 15 min and 4 h. Then cytofluorimetric analysis (events = 5000) was performed as described in Section “Materials and Methods.” Filled histograms represent fluorescence in absence of NF-κB inhibitor pre-treatment, black lines represent fluorescence in presence of NF-κB inhibitor pre-treatment. A PE-conjugated isotype-matched mAb was used as a negative control. Neutrophils untreated or treated with PE-conjugated isotype-matched mAb showed similar results. Histograms are representative of n = 3 experiments with similar results.