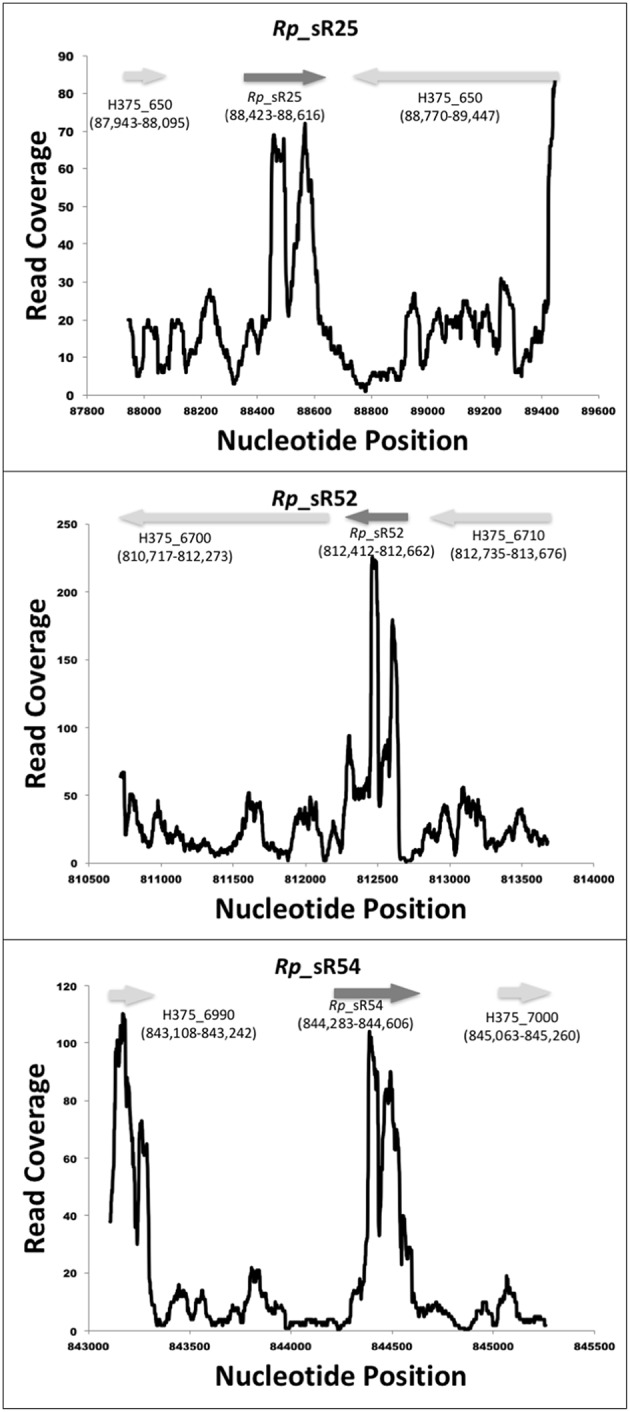
Figure 1.

Identified novel trans-acting candidate sRNAs. Shown are the coverage plots for selected trans-acting sRNAs. Nucleotide positions within the genome are indicated on X-axis and the Y-axis displays the number of reads for that particular nucleotide position. The dark gray arrow represents the small RNA. The light gray arrows represent the orientation of upstream and downstream ORFs, respectively.
