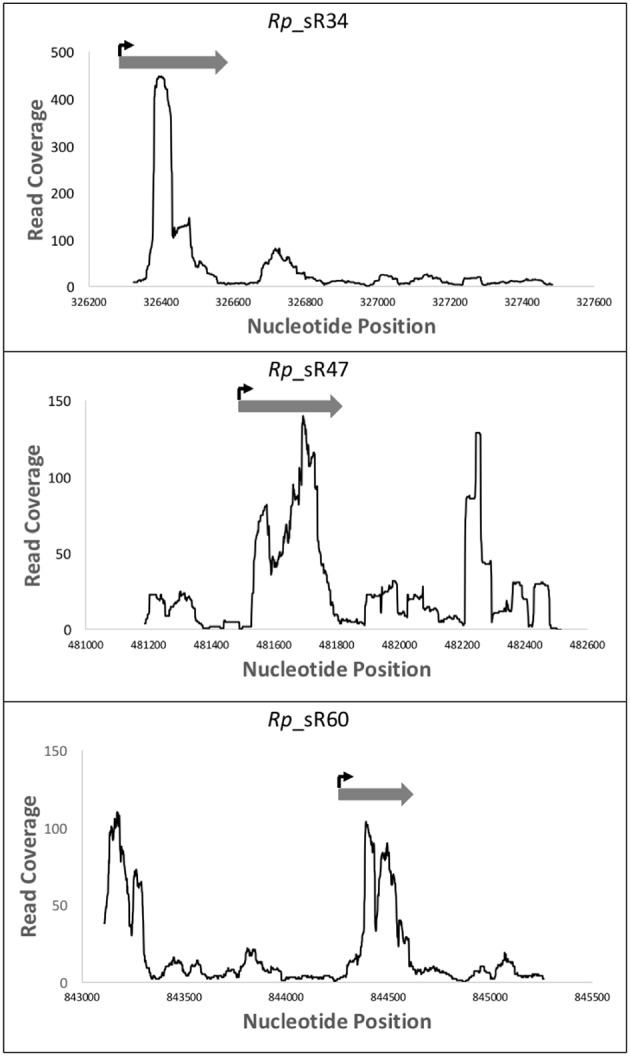
Figure 4.

RLM-RACE transcription start site compared to RNA-Seq read coverage. This representation demonstrates the location of the sRNAs transcription start sites as determined by the sequencing data from 5′ RLM-RACE. These data have been overlaid with the mapping reads obtained from RNA-Seq. Nucleotide positions within the genome are indicated on X-axis and the Y-axis displays the number of reads for that particular nucleotide position. The dark gray arrow represents the small RNA as defined by the RNA-Seq reads, while the bent arrow represents the location of the transcription start site as determined by the 5′ RLM-RACE sequencing.
