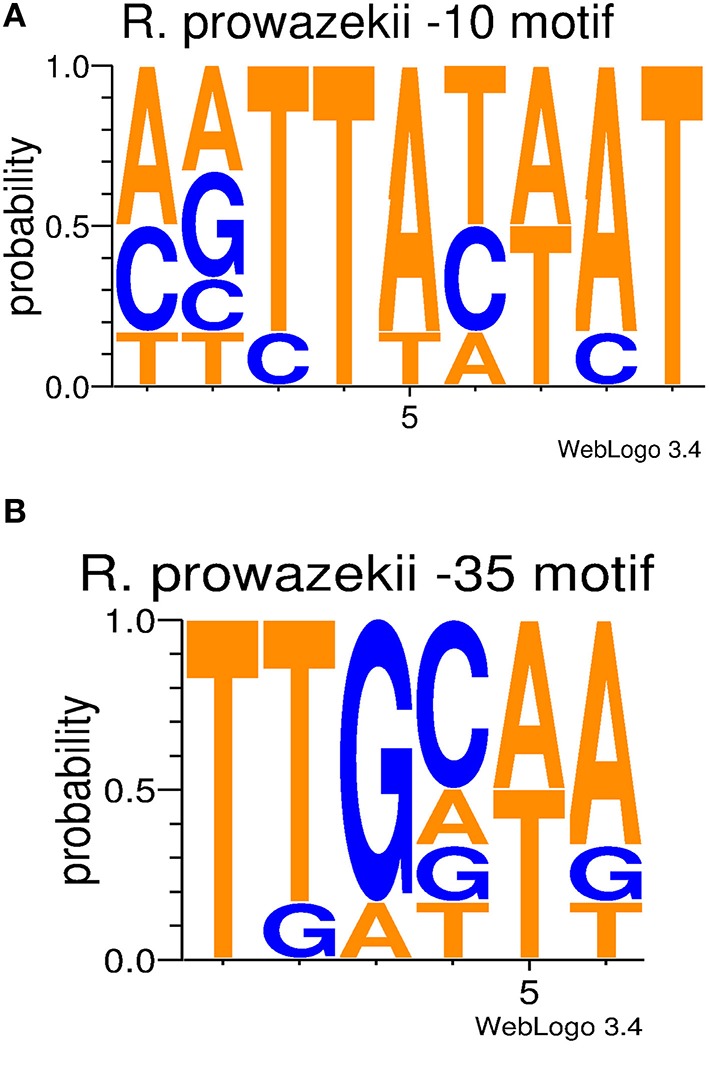
Figure 5.

sRNA promoter frequencies. Conservation diagrams illustrating the probability of a nucleotide in a specific promoter motif position based on the confirmed sRNAs. Panel (A) shows the −10 promoter motif, while Panel (B) represents the −35 promoter motif. The predicted −10 motifs are similar to the E. coli consensus sequence (TATAAT). On the other hand, the −35 motifs differ in comparison to the E. coli consensus sequence (TTGACA).
