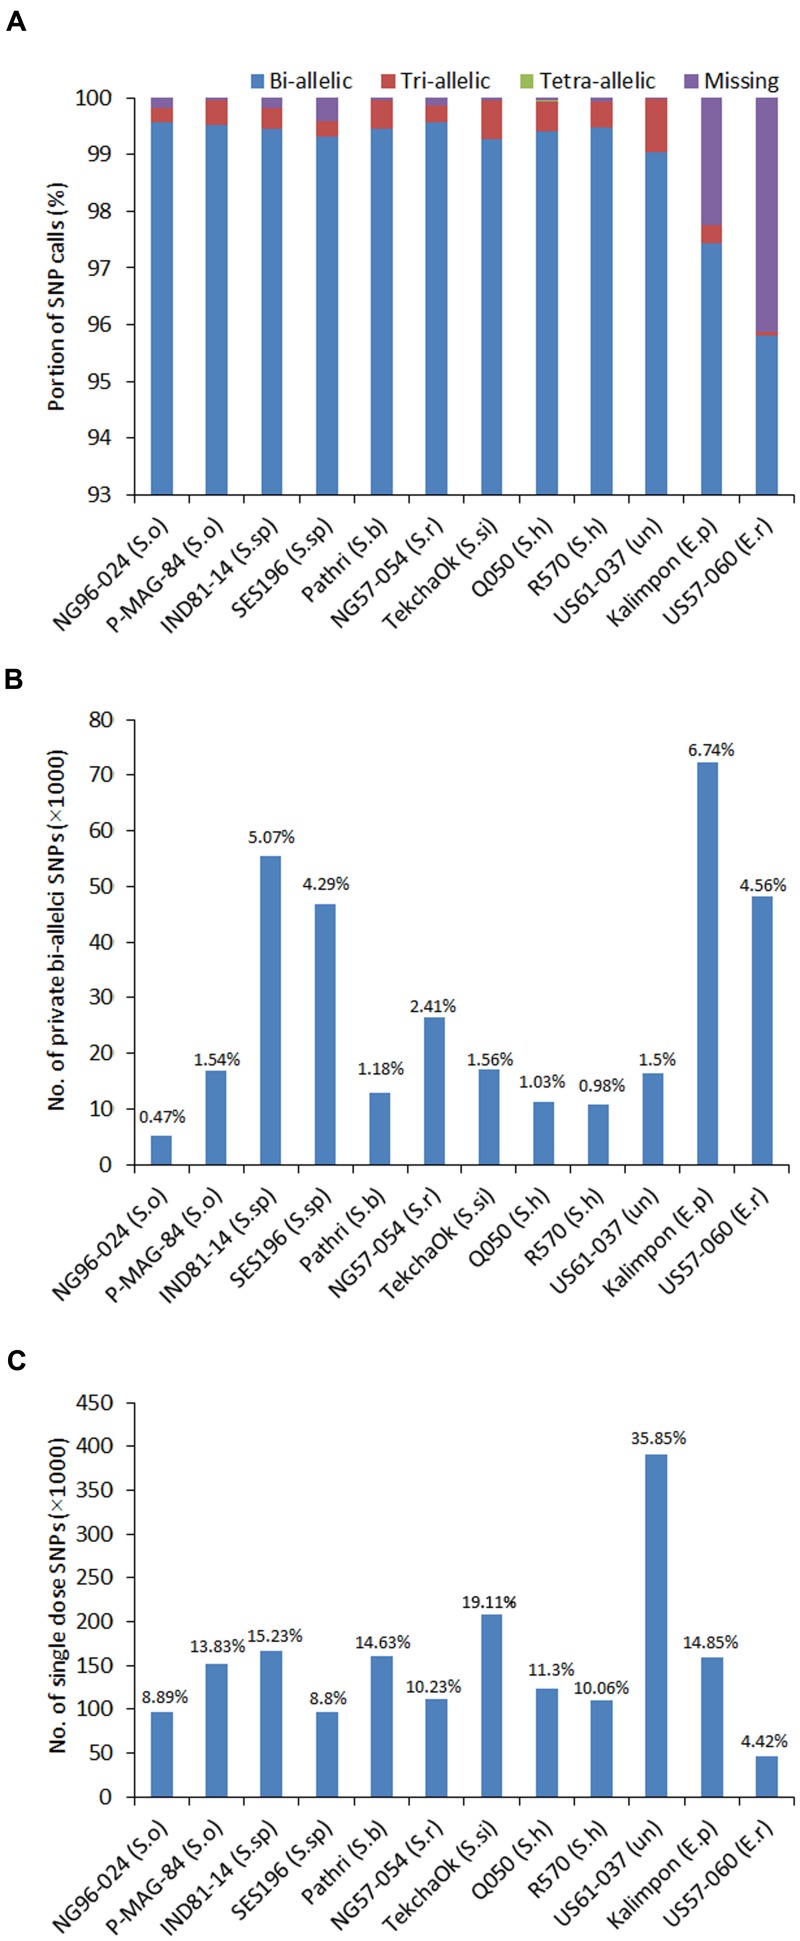
FIGURE 3.
Distribution of SNP types and genotypes. (A) The percentage of various SNP calls including bi-allelic, tri-allelic, tetra-allelic SNPs and SNP loci with missing data for 12 accessions; (B) The percentage of the genotype-specific SNPs called for each accession; (C) The number of single-dose markers called for each accession.

