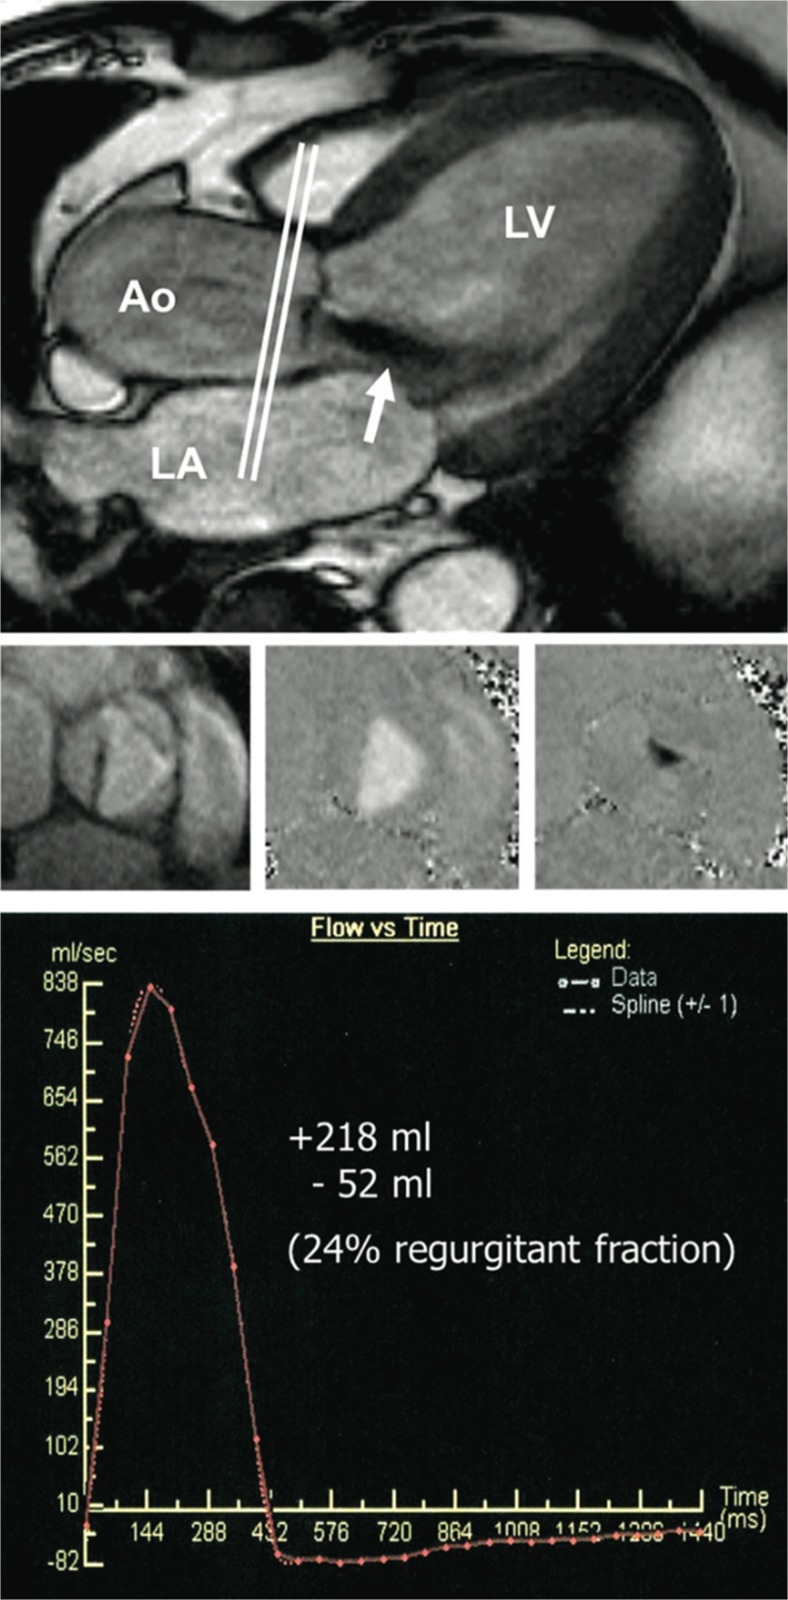
Fig. 5.
Phase-contrast velocity mapping for aortic regurgitation quantification. The slice location for through plane measurement is shown on a three chamber still image (top) with a jet of aortic regurgitation visible (white arrow). Through plane images are shown (middle) in systole depicting magnitude (left) and flow (middle) and diastole showing regurgitation in black (right). Regurgitant volume and fraction can then be calculated from a time-flow curve (bottom). LV left ventricle, Ao aorta, LA left atrium. Reproduced from Myerson et al. [106••] with permission from Wolters Kluwer Health, Inc./Circulation

