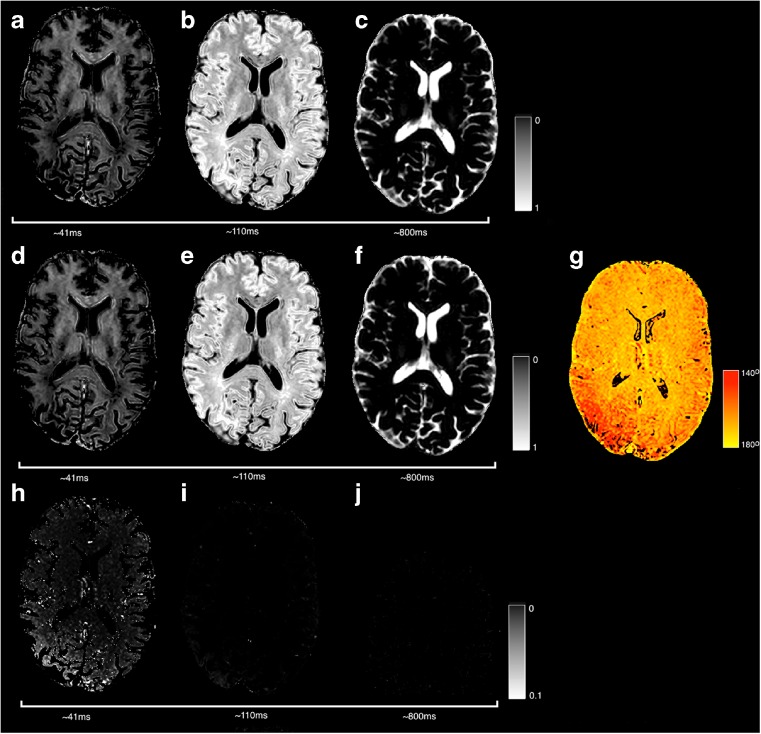
Fig. 10.
Comparison of a multi-compartment fit with (top row) and without (middle row) the EPG algorithm (case C). Differences (bottom row) are of note in the posterior right section of the short-component image which has higher component intensity when using the EPG algorithm. This region corresponds to a region of B1 inhomogeneity estimated by the EPG algorithm and displayed in G

