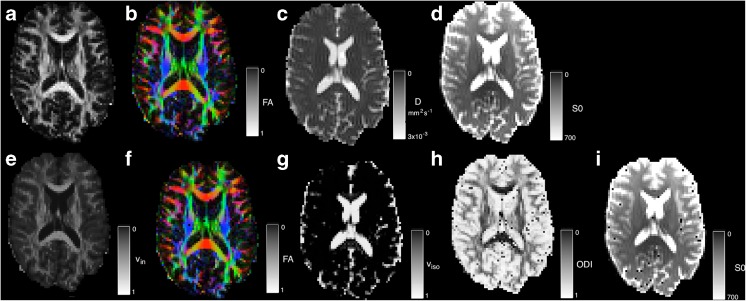
Fig. 15.
DWI parameter map comparison of DTI and NODDI parameters. a–d) represent DTI parameter estimates: a FA b colour-coded FA (red = ML, green = AP, blue = SI), c) the MD and d) S0. e–i) NODDI fitted parameters for e the intra-axonal volume fraction v in, f changes to the PDD, g the estimated isotropic volume fraction v iso, h the estimated tissue orientation dispersion index, ODI and i the S0

