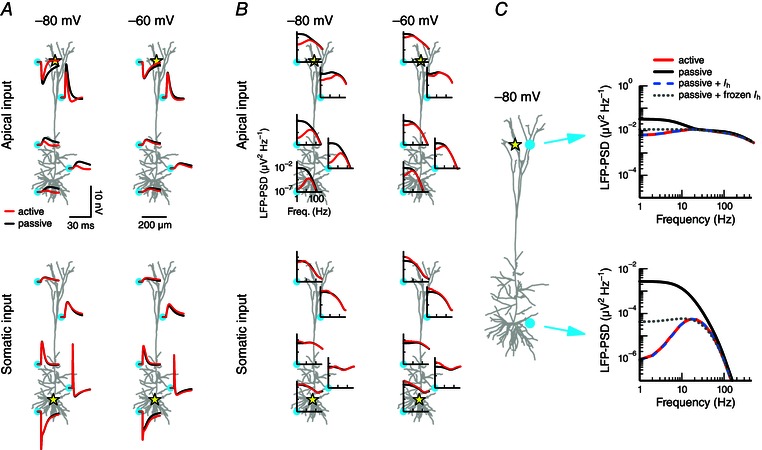
Figure 1. Active conductances can shape the extracellular signature of synaptic inputs .

A, a single synaptic input is provided to a cortical layer 5 pyramidal cell model. The extracellular response is shown at five positions (cyan circles) for two cases: the active model that includes various voltage‐dependent conductances (red; see Methods), or a passive model from which the active conductances have been removed (black). The position of the input is marked by the yellow star: at the distal apical dendrite (top panels) or at the soma (bottom panels). The cell's resting potential was held uniformly at a hyperpolarized potential of −80 mV (left panels) or at a depolarized potential of –60 mV (right panels). The synaptic peak conductance was 0.001 μS. The plots show the x–z plane of the cell; the soma and the electrodes are positioned at y = 0. B, as in A, but using white‐noise current input (see Methods) instead of synaptic input, and displaying the response as the power spectral density (PSD). The PSD is calculated from 1000 ms simulations. C, apical input (marked by star) to the cell model held at a hyperpolarized potential (–80 mV). The extracellular potential is shown at two positions (cyan circles) for the active (red) and passive (black) model and for two additional versions of the model: the passive model supplemented by I h (dashed blue), and the passive model supplemented by frozen I h (dotted grey; see Methods).
