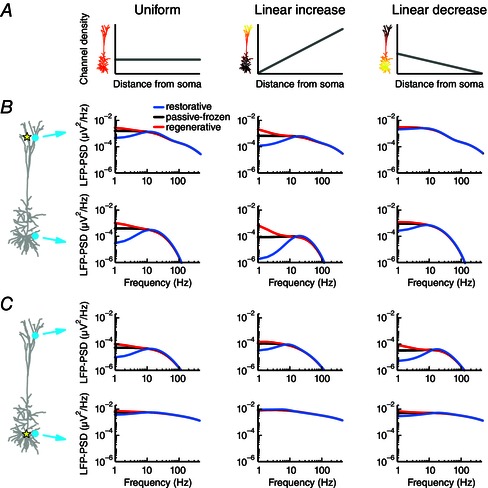
Figure 3. The type of active conductance, its distribution across the cell membrane and the location of the input shape the LFP .

A, a single quasi‐active conductance was distributed across the pyramidal cell model in three ways: uniformly (left), linearly increasing (centre) or linearly decreasing (right) with distance from the soma. The density of the linearly increasing conductance increased 60‐fold from the soma to the most distal apical dendrite, while the linearly decreasing conductance had a sixty‐fold decrease over the same range. B, apical white‐noise current input (yellow star) was provided to the cell model and the LFP‐PSD was determined at two positions (cyan circles). The quasi‐conductance was either regenerative (red), passive‐frozen (black) or restorative (blue). The three cases had the same total resting membrane conductance and the total passive leak conductance was equal to the total quasi‐active conductance. C, as in B, but with white‐noise current input provided to the soma.
